
| Crypto Words has moved! The project has migrated to a new domain. All future development will be at WORDS. | Go to WORDS |
 Crypto Words is a monthly journal of Bitcoin commentary. For the uninitiated, getting up to speed on Bitcoin can seem daunting. Content is scattered across the internet, in some cases behind paywalls, and content has been lost forever. That’s why we made this journal, to preserve and further the understanding of Bitcoin.
Donate & Download the August 2018 Journal PDF
Remember, if you see something, say something. Send us your favorite Bitcoin commentary.
If you find this journal useful, consider supporting Crypto Words by making a donation buying us a beer.
The Cost & Sustainability of Bitcoin
By Hass McCook
Posted August 1, 2018
This paper was transcribed from a .pdf and the editor did his best to make sure all charts came over in correct fashion. We wanted to include a direct download link to Hass’ paper in case you’d like to see this in the raw whitepaper form.
Foreword
To understand the nature of Bitcoin and its ties to energy (spelled with a lower-case e), one needs to understand the concept and nature of “Capital-E” Energy . Energy is the prevailing force in the universe - both Father Time and Mother Nature. It cannot be created or destroyed, only transformed from one state to the other. It is the finite but infinitely divisible, shape-shifting sole ingredient of the universe. Its force cannot be stopped, only harnessed through its good graces. The Big Bang can be considered the “Birth of all Energy and Laws of Nature”. Bitcoin’s “Big Bang” was the codified creation of 21 million coins, of which 50 were discovered in the mining of the Genesis Block . Since then, 17 million have been discovered, with the rest to be mined in a predictable manner over time.
Energy is split infinitely into units of lower-case energy and mass (calories, joules, pounds, kilograms etc.), just as Bitcoin is infinitely split into units of bitcoin – no mass, just energy . From here, the link between Energy & Bitcoin becomes evident when looking at Nature and Life, and the economic evolution of humans.
At the most primal level, the first instinct of Life is to survive. Energy is Life, and Life is sustained by energy. Plants get their energy from photosynthesis. Predators do this by consuming more calories than they used to hunt their prey. Human Civilisation has evolved to the point where we can transform Energy into a state of Power (fire, steam, coal, batteries, fuel cells, etc). This has taken us from harnessing fire to cook food millennia ago, to much more capable energy sources now. Thanks to all the energy we produce, Humans now expend their calories in the pursuit of currency and money to purchase their food calories and other things required for survival and store the rest for future use.
There are huge differences between currency and money . Money is finite, whereas currency is not, and can therefore be compared to energy, and retains its stored energy over time. When the Gold Standard was abandoned, our paper currency became backed by nothing but promises. Ever since then, the value of currency has tended to zero, and money to infinity. Currency violates the rules of Energy by being created out of nothing (aside from the comparatively infinitesimal energy used to print out currency and mint coins). Disrespecting nature has led to dangerous levels of global wealth and income inequality, and widespread social and economic suffering. No form of life has defied Energy and survived in the long term, and this has been the case for billions of years.
Cryptocurrency is the “ Life” of money, of which Bitcoin was “first-life” – literally converting energy into money. It has evolved to keep meeting market needs and sprouted a thriving cryptocurrency ecosystem. Bitcoin was designed to last as long as humans do, wherever they are in the universe with a communications link. Obviously, in the distant future, if humans have stood in the face of Energy and not harnessed it in a clean and renewable way, they will perish. Therefore, as we continue to advance technologically, the Bitcoin Blockchain will be a permanent emissionless store of “ monetary energy” – money secured and proven to be both finite, and earned through hard work (literally, “Proof of Work”), using massive amounts of energy in the process.
Executive Summary and Preface
All data used in this paper is as at Block 534,240, mined on 29 July 2018. Network Difficulty was roughly 5.95 trillion. Hash Rate was roughly 42.6 EH/s. Price on the Bitfinex exchange was roughly USD$8200. The changes in mining ecosystem metrics since January 2015 are shown below:
| Metric | January 2015 | July 2018 | Change |
| $/GH | $0.65 | $0.037 | -94% |
| W/GH | 0.89 | 0.098 | -89% |
| Network Hash Rate | 295.4 | 42587.7 | 14317% |
| Price | $200 | $8,200 | 4000% |
This paper serves to update the assumptions used in a prior version of this research from February 20151, and provides a systematic methodology of modelling the environmental and economic costs of Bitcoin. Furthermore, the paper will provide a thorough discussion on the economics of Bitcoin mining to support the underlying model assumptions. Comparative data with the Gold Mining industry will also be revisited.
Based on the assumptions set forth in this paper, the model has estimated the average cost to mine one bitcoin to be roughly $6,450 . It should be noted that this research is an inductive, bottom-up estimate, with the intent to provide a ball-park estimate. A sensitivity analysis has also been undertaken to demonstrate range of costs under different scenarios, which shows a realistic range of average mining cost of between $5400 (driven by aggressive electricity price assumptions), and $7500 (driven by hash rate increase assumptions). Due to the nature of competition in the Bitcoin mining market, costs that are significantly higher than the market price of Bitcoin can generally be ignored in the short term.
Major Assumption Updates
- The previous version of this research omitted the cost and impact of air-conditioning to the network, so the tonnage of CO2 was underestimated by over a third. It also did not capture the impact of manufacturing, packaging and air-freight transportation of ASIC mining rigs, or the impact involved in the resource extraction or recycling process. The new methodology set forth in this paper captures these items, and the result is a Bitcoin network that exhales 63 million tonnes of CO2 per year – about 0.12% of global greenhouse gas emissions2,3,4 (37 Gt CO2 + 16.5 Gt CO2e). Of the 160,000 TWh of energy generated globally each year5, the Bitcoin Network chews through about 105 TWh/year (0.0661%). It should be noted that all figures include the impact of the manufacture ofASICs, which represent over 50% of all emissions generated.
- In early 2015, the fee market was almost non-existent. In 2015, the average daily miner’s fee revenue was 22.4 BTC. For the six years between 2009 and 2015, the average was only about 15 BTC. In the past 6 months, daily revenue has been very consistent, hovering at just under 50 BTC/day. To that end, this extra revenue has been accounted for in this update.
Acknowledgements
Thank you to Lena Klaaßen for her review of my methodology and calculations.
Bitcoin Economics
Organizational decision-makers set their strategies in line with their firm’s microeconomic, macroeconomic, and global competitive contexts. In the case of a Bitcoin mining firm, the context is as follows:
- Microeconomy: All other Bitcoin mining firms
- Macroeconomy: All other Bitcoin ecosystem members
Global-Macroeconomy: All other digital and non-digital assets and global fiat monetary systems
This chapter defines the nature of competition within these three contexts and will assert that the nature of competition in the Bitcoin mining industry is perfectly competitive in the long term. This will lead into discussion on the strategic machinations of bitcoin mining firms, through comparison of empirical data and academic theory on firms in perfect competition.
Bitcoin Mining in the Global Monetary Macroeconomic Context
The Global Macroeconomy (GM) is the all-encompassing sum of all monetary systems, from traditional “analogue” financial systems, to digital ones like Bitcoin. All exchanges of value, legitimate or not, occur within it. Firms within the Bitcoin mining market service the Bitcoin ecosystem and depend on it being healthy and diverse in order to prosper6 .
” [Accelerated] globalization [has] yielded conditions of considerable oligopoly in the world economy“7 . Some criticize the legacy system as the inadvertent/deliberate proprietor of global inequality8, 9, with ever-mounting barriers to entry deterring the emergence of competing monetary systems. History shows that Schumpeterian gales of creative destruction eventually blow these barriers away10 . In the case of the GM, this was the invention of The Blockchain, of which Bitcoin11 is the first and largest implementation12 . At that moment in history, the GM effectively split into the pre-2009 “analogue” GM, and the parallel digital one. Due to age, complexity, and nationalistic necessity, the legacy GM can only experience bursts of improvement13 and remain a “closed ecosystem”14,15 . In the highly competitive-yet-collaborative open-sourced decentralized digital ecosystem, anyone in the world can collaborate with others or create new or copycat ecosystems through the open-source software movement16, ensuring evolution and adaption to changing market needs.
To that end, Bitcoin mining firms operate almost exclusively within the digital Global Macroeconomy, and the Bitcoin Mining Market in particular. They have an eye towards alternative digital ecosystems that are gaining traction in the wider free market, and whether their mining equipment can also mine these alternative digital currencies. The competitive cycle between them and their peers resets roughly every fortnight17 .
Bitcoin Mining in the Bitcoin Macroeconomic Context
The Oxford Dictionary defines an economy as “ the state of a country or region in terms of the production and consumption of goods and services, and the supply of money”. Since “country” or “region” do not apply to digital ecosystems, it is difficult to use traditional macroeconomics which rely exclusively on the concept of an influential controlling body to analyse them.
Bitcoin’s monetary policy is highly predictable and based on a consensus-based, cryptographically secure, selfmanaging algorithm18 . Bitcoin firms can move to the physical jurisdictions that provide the best incentives (i.e. low power, favourable business and tax laws, etc.). In the legacy global financial system, this option is only available to large multinational corporations19, with most consumer-level participants lacking the mobility to move to the jurisdiction of their choosing20 . This is inherently different in a permissionless, online, jurisdictionagnostic environment.
Bitcoin’s ecosystem is still small and fragile, but its incentive structure becomes more robust as more participants are attracted to the ecosystem6 . Rational Bitcoin miners want to see the demand for their commodity grow organically and sustainably, but this is difficult. Miners mine an intangible digital commodity whose fundamental value relies on a consensus-based economic protocol and network. Its market price is based on the whim of the market. Every shock to the ecosystem, such as failure of wallet services and product providers21, at least 36 exchanges22 including the disastrous MtGox collapse23; online drug markets24, Government crackdowns25 and auctions26; scam-coins27, developers28, even miners themselves29, and everything else in a long list of Bitcoin disasters, has in several cases caused dramatic and sudden movements in the price of the commodity30 . Considering the evidence, Bitcoin is an example of an anti-fragile31 system, with bitcoin achieving year-on-year growth in most key metrics32,33 despite the numerous aforementioned setbacks. When and if the market becomes large enough to be less vulnerable to shocks, consolidation through means of integration and merger-and-acquisition activity amongst firms will be witnessed59, as will be discussed in the next section.
Perfect Competition & Bitcoin Microeconomics
The example of “the hypothetical firm in a perfectly competitive market” is taught in most introductory economics classes. A literature review of primary academic texts34,35,36,37,38,39 identifies nine conditions that define a perfectly competitive market:
| Homogeneous products | no barriers to entry or exit |
| guaranteed property rights | many buyers and sellers |
| non-increasing returns to scale | perfect information |
| zero transaction costs | no externalities |
| perfect factor mobility |
When compared with real world data, the Bitcoin mining market (BMM) does not meet all aforementioned conditions of perfect competition, due to a relatively low number of ecosystem participants, currently resulting in wealth and information asymmetry. However, the BMM is trending towards becoming perfectly competitive as the wider Bitcoin macroeconomy grows, which will now be demonstrated.
As at date of writing, the BMM satisfies six criteria of a perfectly competitive market. Bitcoin’s nature as an open-source, encrypted, distributed ledger means that the blockchain guarantees property rights and homogeneity, at zero or near-zero transaction and storage cost40 . The factors of production (labour, equipment, and capital) are mobile to the extent that only a communication link and a power source is required to participate in the ecosystem. Due to its economic incentive mechanisms11, any mining entity approaching 50% of network hash rate (NHR) would experience non-increasing returns to scale, if not jeopardize its own existence, as witnessed during the GHash.io saga of 201441 . Developing on top of Bitcoin requires no permission, and if entrepreneurs have a good enough idea, securing start-up capital is not a difficult barrier to entry to overcome, with over one billion US dollars invested in Bitcoin start-ups to date42 . Low barriers are also commonplace in very young markets, with imitative entry into the market quite rampant43 . Conversely, barriers to exit are quite low for most market participants except for heavily leveraged or undiversified miners, who risk holding highly specialized computing equipment that may be unable to mine other digital commodities. This is no different to traditional undiversified commodity miners44 .
The satisfaction of the final three conditions relies solely on the growth of the network and passing of time. The current size of Bitcoin’s user base is speculative, and always will be due to its pseudonymous nature. CNBC reported45 that 8% of American adults had invested in cryptocurrency (or, 8% of 250 million people46 = 20 million). Yahoo Finance reported47 that 16.3 million Americans buy and sell bitcoin frequently. Coinbase reports that they have over 20 million users48 . Meanwhile, in some parts of Europe is estimated that an average 4% of consumers use cryptocurrency as a payment method every day as of 2016, with Eastern Europe leading the charge at 11%49 . The numbers play out as follows50:
| Country / Region | Adult Population (millions) | Users as % of Population | No. Bitcoin Users (million) |
| USA | 250.0 | 8% | 20.0 |
| Eastern Europe | 260.7 | 11% | 28.67 |
| France | 56.8 | 4% | 2.27 |
| Germany | 73.4 | 2% | 1.47 |
| UK | 57.6 | 1% | 0.58 |
| Spain | 41.5 | 2% | 0.83 |
| Switzerland | 7.6 | 2% | 0.15 |
| Benelux | 25.8 | 2% | 0.52 |
| Total 54.5 |
Table 1 - No. of Bitcoin Users - High Estimate
When adding US and European numbers, and noting that data for Asia, Africa, Latin America, and Oceania are omitted, a high estimate of over 50 million users can be made. Although this sounds like a market with “many buyers and sellers”, 50 million people only accounts for 0.8% of the World’s adult population50 . A much lower estimate of between 2.9 million and 5.8 million has been highlighted in a very detailed assessment of the global cryptocurrency market produced by Cambridge University in April 201751 (granted, things have changed dramatically since April 2017 when price was only USD$1000, right before the “big hype” of late 2017, where a significant number of new users would have come into the ecosystem).
From a commercial markets point of view, a strong case can be made that a few participants have an inordinate, albeit temporary, grip over pricing and information. The temporary nature is shown in the table below, comparing wallet balance distribution since December 2014. We can see that there has been a flatting of the distribution of coin holdings away from large wallet balances to much lower balances. As can be seen, coins held in wallets with balances containing between 0.001 to 10 BTC have grown dramatically, and it could be expected to resemble a normal distribution as the decades move on.
Dec-201452 Jun-201853
| Balance | % of all BTC | % of all BTC | Δ |
| 0 - 0.0001 | 0% | 0.01% | - |
| 0.001 - 0.01 | 0.02% | 0.12% | 500% |
| 0.01 - 0.1 | 0.16% | 0.73% | 356% |
| 0.1 - 1 | 0.85% | 3.23% | 280% |
| 1 - 10 | 4.76% | 8.70% | 83% |
| 10 - 100 | 26.73% | 25.57% | -4% |
| 100 - 1,000 | 23.40% | 21.80% | -7% |
| 1,000 - 10,000 | 23.40% | 19.92% | -15% |
| 10,000 - 100,000 | 17.02% | 17.28% | 2% |
| 100,000 - 1,000,000 | 3.66% | 2.64% | -28% |
Table 2 - Distribution of Coins (by wallet balance)
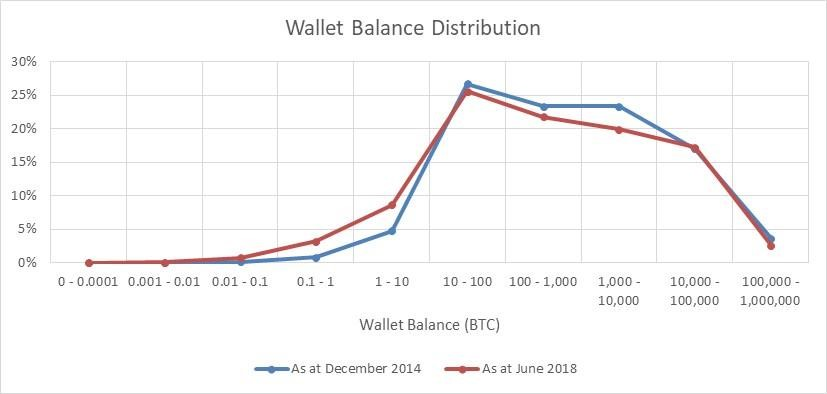 Figure 1 - Distribution of Coins (by wallet balance)
It should be noted that all wallets with a balance of over 100,000 coins belong to identified exchanges / custodial wallets53 . The identifiable custodial wallets, alongside their “total wallet balance rank”, is as follows:
| Rank | Custodian | Qty BTC | Rank | Custodian | Qty BTC |
| 1, 441 | Bitfinex | 175,172 | |||
| 2 | Binance | 174,759 | |||
| 3 | Bittrex | 117,203 | |||
| 4 | Huobi | 98,042 | |||
| 5 | Bitstamp | 97,848 | |||
| 28 | Coincheck | 34,277 | |||
| 55, 58, 117, 125, 167 | Kraken | 70,805 | |||
| 177, 447 | Xapo | 8,911 | |||
| 264 | AnxPro | 4,712 | |||
| 353 | Bitmain | 3,372 | |||
| 255 | BitX.co | 4,966 | |||
| Identifiable Coins in Custody | 790,067 |
Table 3 - Bitcoin Held in Identifiable Custodial Accounts
The above table does not include coins held in custody by other major custodians such as BitMex, Poloniex, Coinbase, and others. It is expected that a lot of wallets with very large balances are custodial wallets, especially as those wallets have several hundred inputs and outputs over a short period of time, which means that the distribution may be even flatter than demonstrated above. A study of Bitcoin Unspent Transaction Outputs (UTXO) by Unchained Capital54 studying the shift of old coins into new hands over time, noted that 15% of BTC moved out of wallets that had been dormant for 2 to 5 years during the 2017 Bitcoin rally. This trend of a flattening in distribution is expected to continue, as spent bitcoin is spent forever, and needs to be earned back.
Bitcoin’s current major externality is the CO2 emitted by hardware operating and securing the network, which is discussed in depth over the next few chapters. Therefore, as the world moves towards carbon-free energy sources over the coming centuries, in additional to cleaner and more efficient mineral mining and e-waste recycling technology, Bitcoin’s CO2 emission externalities will eventually tend towards zero. Based on strong and predictable trends indicating technological improvements driving down costs of renewables55, as well as the potential for fossil fuels to be priced fairly (i.e. more expensively) under future carbon trading schemes56, we may witness a more expedient migration to renewables. As history has shown several times, the death of an incumbent technology is swift when displaced by something better57 .
Bitcoin is not perfectly competitive in its current state but is very close to becoming so. The first six of the above conditions are met in the short-term, with the last three destined to be met (if not already partially met), should Bitcoin have a “long-term”.
Most importantly, in a perfectly competitive environment, marginal cost to produce a good (MC) is equal to the marginal revenue from selling that good (MR), i.e., in long-term equilibrium, cost to mine will be equal to the price of a bitcoin, and in the short term, this equilibrium point will be established by the market.
Perfect Competition & Managerial Economics
The Porter’s Five (or Six) Forces58 framework is a mainstay of the MBA Curriculum. The forces within the Bitcoin mining market are illustrated below.
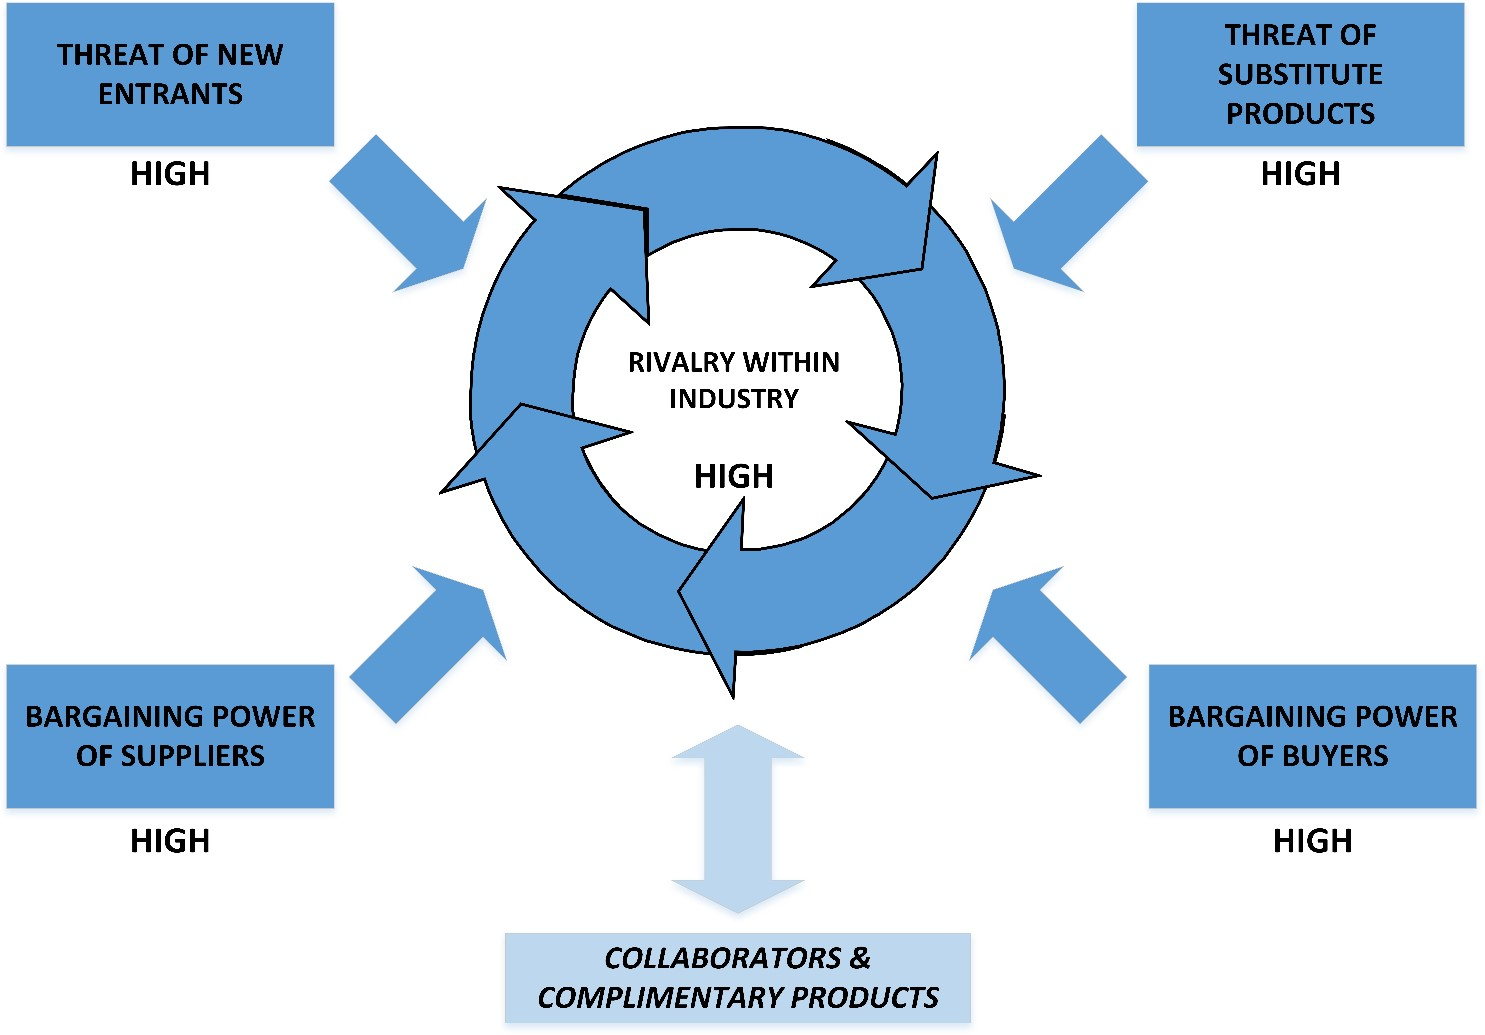 Figure 2 - Porter’s Five Forces Analysis of the Bitcoin Mining Industry
Mapped out, prospects look quite daunting for an industry competitor. They cannot easily protect themselves from new miners or substitute products such as other digital currencies. They are price takers with little power over their buyers, and unless they are an innovation leader in the fields of hardware manufacture and research-and-development, data centre ownership, and/or electricity provision, they have little control over their suppliers too. As mentioned previously, collaborators (i.e. other ecosystem participants) currently have equal potential for benefit and detriment whilst the market is still susceptible to shocks. Competition is stiff within the mining industry, and a prompt extinction awaits if you are not a cost or innovation leader57 . This is expected - economic profit tends to zero in long-term equilibrium in a perfectly competitive landscape34, and the marginal cost of producing and the market price oscillate around an equilibrium point34, with evolution and improvement the only way to stay in business. In such competitive markets, there is also a natural tendency for the market to be dominated by three or four players59,60 . The Pareto Principle, also known as the 80/20 rule61, states 20% of the market participants control 80% of the market. In November 2015, the 5 largest pools provided 79% of mining power. In June 2018, the largest 5 provided 70% of hash rate, with 78% of power coming from the top 6. That said, the pools are not monolithic entities.
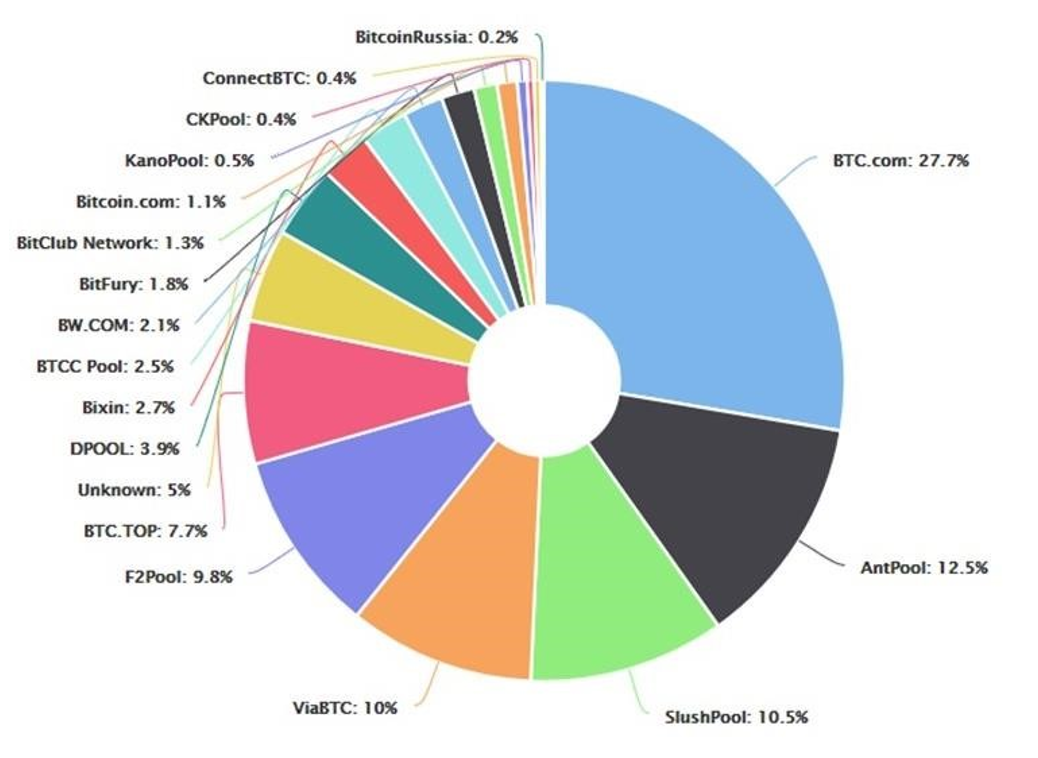 Figure3 - Bitcoin Network Hash Rate (NHR) Distribution
In a perfectly competitive market, a firm’s decisions are predictable. All firms need to decide to start up, how to run their business as cost-effectively as possible, and whether to stay in business or not. In the Bitcoin world, the decision-making process relies on market price of bitcoin, operating expenditure, and the network hash rate, i.e., how much competing “mining” power exists on the network. It also indirectly relies on the continued faith and investment of miners in the value of their commodity i.e. continued research, development, capital expenditure, and strategic partnerships with collaborators. Table 4 shows the relationship between hash rate and price and shows the outcomes for miners in six different scenarios.
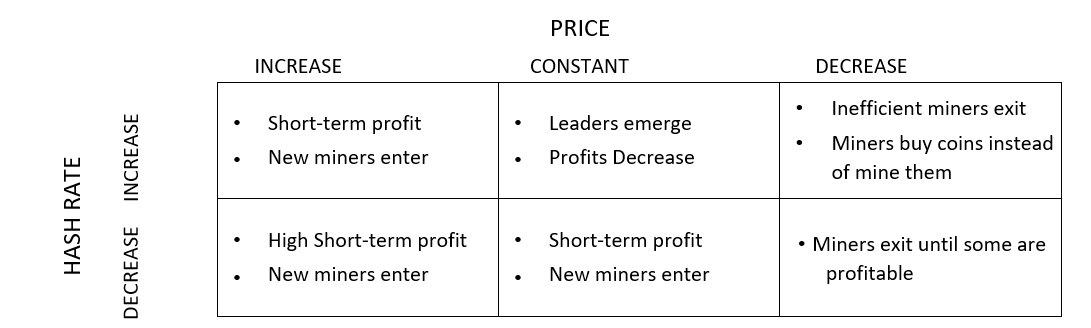 Table 4 - Price - Hash Rate Relationship Matrix
Effectively, if price of the commodity (i.e. demand) increases well beyond the cost to mine the commodity, miners will enter the market until the price and cost are equal. If price decreases, miners leave the industry until there are only profitable miners (i.e. either cost or innovation leaders) remaining. If price is dramatically lower than cost to mine, some miners may elect to simply buy bitcoin up to the current cost to mine. If the market is flat, profit tends towards zero until the market is shaken up again. This is similar to the workings of physical commodity miners in the commodity63 and oil64 industries. The difference is that a Bitcoin firm’s decisions take hours and days to implement, and days and weeks to take effect, instead of months and years. The same is true regarding the time taken to reach equilibrium after a price shock; “two-to-four times the duration of the production-to-storage cycle” (i.e. months to years) for commodities65, weeks for Bitcoin.
Trends & the Future
Since the future appears full of opportunities for the digital macroeconomy, one should expect digital microeconomies to become more perfectly competitive as time passes. Should long amounts of time, say, 50 years pass, when all bitcoins have effectively been mined, and the ecosystem is still healthy and has entered the redistribution stage, microeconomies such as the bitcoin mining market will start to resemble the textbook examples of perfect competition. In time, miners will vertically integrate backwards66 by acquiring data centres, chip fabricators, research-and-development teams, and renewable power plants; and integrate forwards by acquiring exchanges, brokers, and other places to sell what they have mined. They can horizontally integrate66 by acquiring entities that enrich the value of their commodity such as wallet hardware and other product manufacturers, financial services companies, and media outlets. 80% of the market will be controlled by the 20% of the largest and most integrated market participants61, with the other 80% providing the niche and evolving needs of the market. As time goes on, the makeup of the microeconomy will evolve until its extinction and replacement10 .
Now that you have a very thorough understanding of the market, and what is going through a miner’s mind, the focus of the paper will shift to the cost of mining Bitcoin.
The Evolution of the Bitcoin Mining Industry: January 2015 – Now
Mining Technology
Since the last analysis, Bitcoin mining technology has improved dramatically. The benchmark used back then was Bitmain’s Antminer S5. We will look at the S5 compared to its current successor, the Antminer S9i67 .
| January 2015 | June 2018 | % Change | |
| Network Hash Rate | 295.4 PH/s | 36346.2 PH/s | +12,200% |
| Retail-Best Miner | Bitmain Antminer S5 | Bitmain Antminer S9i | |
| $/GH (RRP) | $0.65 | $0.047 | -94% |
| W/GH | 0.89 | 0.098 | -89% |
Table 5 - Evolution of Mining Technology
Further to the above, one of Bitmain’s closest competitors, Canaan Creative, comes in with a lower $/GH rate ($0.044) when excluding PSU costs from both rigs, but a 15% higher W/GH value (0.109)68 . As the market will tend to gravitate towards the lowest total price available, it’s expected that Bitmain controls and ships significantly more hardware than Canaan91 .
Hash Rate Growth
The dramatic drop in $/GH and W/GH shown in Table 5 has spurred extraordinary hash rate growth. That said, this is not a new phenomenon.
Figure 4 shows hash rate growth since the Genesis Block in 200969, showing steady and consistent exponential growth of the network. One of the main drivers of investment in mining equipment is expected hash rate growth from one difficulty cycle to the next. We will explore this concept in further detail in the next chapter. Table 6 shows how consistent fortnightly hash rate growth has been over the past 6 and a half years. Network difficulty grows directly in line with hash rate growth.
| 2012- Current | 2013-Current | 2014-Current | 2015-Current | 2016-Current | 2017-Current | YTD | |
| Average | 9.0% | 9.9% | 7.0% | 5.3% | 5.9% | 6.8% | 7.2% |
| St Dev | 9.9% | 10.2% | 7.3% | 6.1% | 6.4% | 6.7% | 5.7% |
| Sample Size | 187 | 161 | 130 | 100 | 73 | 46 | 17 |
Table 6 - Average Difficulty Change Data
As a result of the constant hash rate increases, the difficulty cycle is rarely 14 days, and based on rough year to date data (7.2% increase per cycle), the difficulty cycle is closer to 14 days x (1 – 7.2 %) = 13 days, or 312 hours.
Should Bitcoin ever scale and reach its potential, it is almost certain that mining equipment will exponentially increase in processing efficiency in line with Moore’s Law for at least another 5 years70 and exponentially increase in power efficiency in line with Koomey’s Law for at least another 25 years71 .
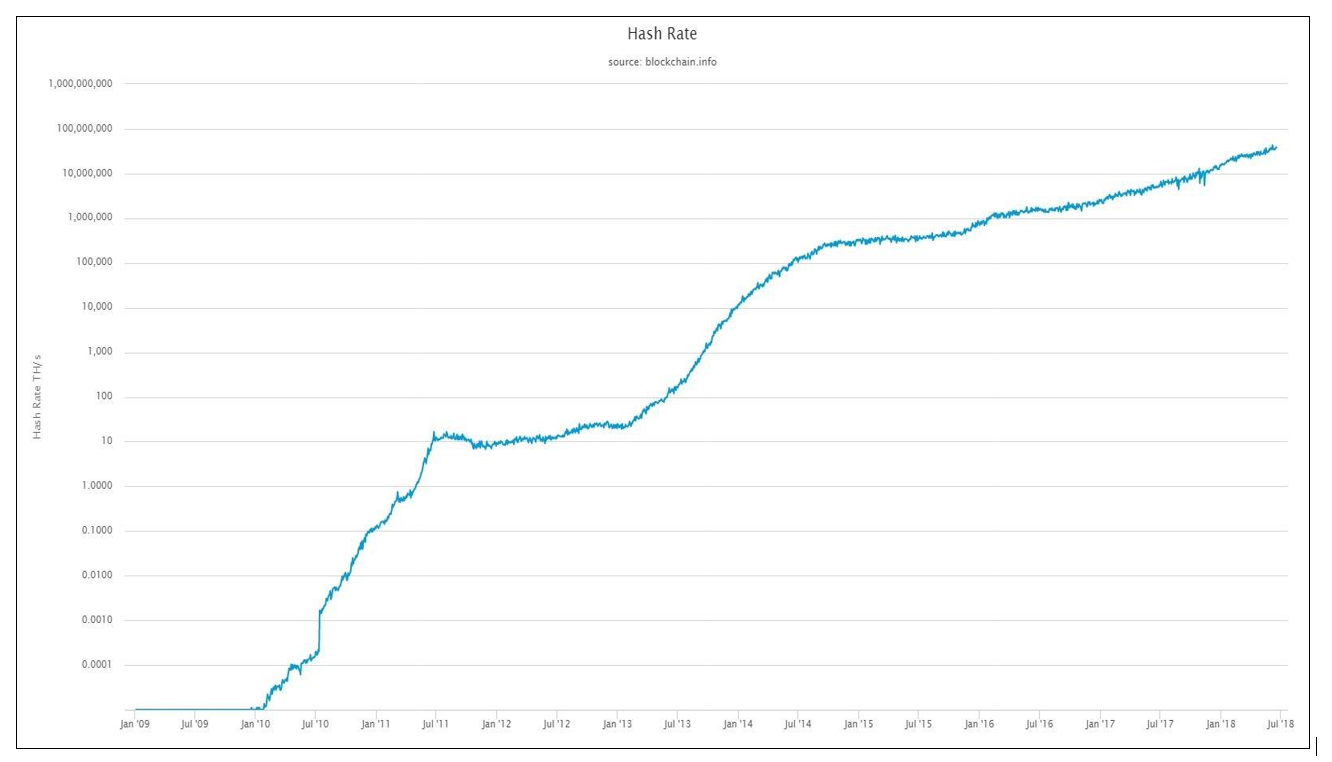 Figure 4 - Network Hash Rate - All-time Data (Log Scale)
August 2018 Edition 10
Understanding the Cost of Bitcoin – Inputs & Drivers
Calculating the costs of Bitcoin can be modelled quite simply through the relationship of the 7 variables defined below.
Economic Cost Inputs / Drivers
CAPEX
CAPEX is the capital expenditure required to maintain a proportional share of mining rewards upon an increase in difficulty. This is typically the purchase of additional GH/s at a particular $/GH rate. This is demonstrated in the below example, assuming the average of 7.2% difficulty increase discussed above:
| Current Difficulty Cycle | Next Cycle (Predicted) | |
| Network Hash Rate | 1000 PH/s | 1072 PH/s |
| Hash Power Provided by Miner / Mining Pool | 300 PH/s | 321.6 PH/s |
| % of Hash Rate provided by miner | 30% | 30% |
Therefore, for the example mining pool to maintain their 30% slice of the pie, they need to bring on 21.6PH/s of hash power.
There are other elements of CAPEX whose life-cycles are much longer than mining equipment. These elements of CAPEX can also be deemed as “sunk costs” in many cases, and don’t affect future decisions. The CAPEX categories are as follows:
- Bitcoin Mining Equipment (typically last for only a few months before they’re unprofitable)
- Power Supply Units (PSU) for mining equipment typically last as long as the mining equipment due to planned obsolesces, with hardware manufacturers regularly changing the required PSU wattage with each new generation of miner.
- Server Racking / Data Centre Construction & Fitout Costs (typically last for decades). Server Racks / Data Centres could also come under Operational Expenses (OPEX) if the Data Centre is being rented / leased. Regardless, these costs are negligible compared to the costs of electricity.
OPEX
OPEX is the expenditure required to remain operational. At scale, this is effectively just the cost of power to the mining equipment and air conditioning within a data centre. It is estimated that cooling can consume 3072 to 40%73 of overall energy consumption, with 21% a benchmark for the most efficient cooling systems74 . Technologies such as immersive cooling will reduce energy consumption as a trade-off for a large initial capital outlay. One should take in account the “Iceland Factor”, where Bitcoin mining uses as much power as all of Iceland’s homes75 due to it being cold enough for data centres to meaningfully reduce cooling costs and having clean and cheap hydro-electricity. At 840 GWh/yr., tiny Iceland would account for about 1% of the world’s mining power. While Iceland is only a very small share of the market, miners have access to several other cold places with cheap electricity76 . For the purposes of this model, we will assume cooling contributes to 20% of the total power consumption, in line with the laws of perfect competition and the technological gravitation towards maximum efficiency.
Difficulty Cycle Length
Network difficulty changes every 2016 blocks. At a fixed hash rate, blocks will take 10 minutes (on average) to mine. This results in a difficulty cycle of 14 days. However, as the network hash rate increases 7.2% on average, blocks will be mined, on average, 7.2% quicker. Therefore, the time-period used to calculate the cost of mining a bitcoin will be the average time between difficulty changes will be taken as 13 days (14 days x 92.8% = 13.00), or, 312 hours.
Coins Mined
This is a fixed number – there are 2016 blocks of 12.5 bitcoins mined every difficulty cycle – 25,200 bitcoins. In addition to the mining rewards, mining fees are not insignificant either77 . The SegWit Wars of the first half of 2017 had fees averaging over 200BTC per day, and the fee madness during the hype cycle of December 2017/ January 2018 had a revenue average of over 550BTC per day over those two months. With the SegWit wars over, and the hype now well settled, a relatively consistent 40 BTC per day has been earned in the 6 months leading to July 31, 2018 (st dev = 35, n=180). Daily average fee revenue trends over time are shown in the table below. For this model, we will use a figure of 650 BTC collected in fees each cycle (i.e. about 50/day for the average 13-day cycle time).
| 09-‘12 | 2013 | 2014 | 2015 | 2016 | 2017 | 2018 | Since Halving | |
| Avg | 6.57 | 43.31 | 12.92 | 22.42 | 62.38 | 273.51 | 105.45 | 177.93 |
| St Dev | 11.46 | 26.12 | 3.83 | 8.35 | 29.34 | 171.55 | 181.47 | 180.42 |
| Sample Size | 730 | 182 | 183 | 182 | 183 | 183 | 211 | 768 |
Table 7 - Daily average fee revenue over time
Power Cost & Emissions
To evaluate power costs and emissions, we don’t have much of a choice but to use world-wide weighted average figures, due to the dispersion of miners all over the world. That said, thanks to the rules of perfect competition, particularly perfect factor mobility, miners will move to places with the cheapest electricity costs. The statistics are as follows78,79,80,81 . The emissions figures consider CO2 equivalents, such as methane, and nitrous oxide.
| Primary Energy Source | % Total PES | g CO2 e/kWh | Low Price ($/kWh) | High Price ($/kWh) |
| Biofuels & Waste | 9.7% | 18 | $0.06 | $0.11 |
| Coal | 28.1% | 600 - 1001 | $0.06 | $0.14 |
| Oil | 31.7% | 778 | $0.07 | $0.10 |
| Natural Gas | 21.6% | 443 | $0.04 | $0.08 |
| Nuclear | 4.9% | 66 | $0.11 | $0.18 |
| Hydroelectric | 2.5% | 13 | $0.02 | $0.19 |
| Other (Wind, Solar, Geothermal) | 1.5% | 20 | $0.03 | $0.11 |
| Weighted Average (approx.) | 600 | $ 0.06 | $ 0.12 |
Table 8 - World Power Costs & Emissions by Energy Source
*Note: When using Carbon Capture Systems (CCS), CO2 emissions from Coal are reduced substantially.
Although the average rate for US industrial companies is about $0.07/kWh82, a safer assumption for Bitcoin miners would be closer to 3 or 4 cents, for the reasons mentioned above. There are several documented cases of the largest bitcoin mining operations paying $0.04/kWh83, with reports that Bitmain was receiving a $0.02/kWh rate in their Yunnan facility84, and one particular CEO claiming a cost of electricity of only 1.7 cents/kWh for their mining operation in Moses Lake, Washington, USA85 .
Mining Mix – “The Network Average Miner”
There are two types of miners; chip-fabricator miners, and retail miners. Retail miners can be split further into another two categories, large retail miners and small/individual miners. Small individual miners can also forego buying hardware themselves, and instead purchase mining contracts. Due to intellectual property and some economies of scale, chip-fabricators (chipfabs) can mine for significantly cheaper than retail miners. Typical gross profit margins in the semiconductor industry has averaged over 45% for a four-year period86, with the most profitable ones close to 60%. The computer hardware industry averages around 35%87 . Gross profit margins are used since operating expenses and depreciation are dealt with separately within the model. It is assumed that miners pay no tax (i.e. they retain all coins that are mined and/or asset depreciation costs are high enough to offset a large amount of tax on revenue from sold mining hardware). Due to the lack of competition in the ASIC hardware space, margins would likely be 50 to 60%. Obviously, there is a limit to the margin that can be made on mining hardware, as the customer base is quite savvy and can easily calculate profitability of their purchased miners at a particular price-point. For the purposes of this study, it will be assumed that Bitcoin ASIC manufacturers make 60% gross margin on all hardware sold.
Determining the number of non-chipfab large miners and individual miners is another area of speculation due to lack of robust market data. One half-insight can be gained from looking at the world’s largest cloud-mining operation, Genesis Mining, who claim to have 2 million users88 . Despite its MUCH higher price per GH/s (27c/GH (including electricity costs and incidentals)89 vs Bitmain’s 3.7c/GH), it may still be practical for many miners to opt for a cloud-based solution due to its “plug-and-play” nature, and more importantly, that it is an “instant-on” solution, so that you don’t lose your most profitable days waiting for your miner to be shipped to you. That said, Genesis provides no data on their aggregate hash power, nor do they reveal details on the location of their server farms, or even which pools they mine on90 .
Next comes the question of chipfabs mining on their own equipment, and how much equipment has made it out into the market for large-scale and small-scale miners. According to an analysis by Sanford C. Bernstein & Co, it was estimated that Bitmain captured 75% of market share in hardware sales, Canaan Creative captured 15% of the market, and other manufacturers made up the remaining 10%91 . Bitmain’s CEO has stated that the company earned USD$2.5B in revenue for 201792, with the majority of that revenue earned through mining sales, as opposed to mining and selling Bitcoin directly. From this, we can size the market for mining hardware to be a maximum of USD$3.33bn, as some part of Bitmain’s revenue would be mining based. Based on the 2017 average price of an S9 miner of around USD$300093, this means that Bitmain shipped over 800,000 units. If Bitmain’s revenue of $2.5B was a 75% share of the market, then Canaan Creative’s 15% share would translate into an annual revenue of around $0.5B, with the remainder of the market making up the remaining $0.33B.
Canaan sells their Avalon miners in a minimum order quantity of 40 units at a very similar price-point to Bitmain, so it is safe to assume that Canaan services medium-to-large scale miners. Putting the numbers together, it is assumed that Canaan would have shipped over 150,000 Avalon units, with the rest of the market producing 100,000 “equivalent” units. Rounding down, one could draw the conclusion that 1 million S9equivalent mining units were shipped.
At this hash rate and price per S9i, this model estimates that roughly $115 million is invested in more mining power every difficulty cycle (see CAPEX on page 16), or around $3.25 billion per year (in line with 2017 figures). Drawing on the 80/20 rule again we can put chipfabs somewhere in the ballpark of 20% of direct hash power. That said, with Bitmain administering at least two mining pools (AntPool & BTC.com)91 providing 40.2% of hash power62, it is likely that they contribute about half of that power or more. Throw in the other chipfabs in proportion to the sales figures mentioned above, as well as any chipfabs that don’t sell to the public, and we will assume that chipfabs provide at least 35% of direct hash power for this study.
Due to the laws of perfect competition discussed earlier, it can be assumed that only the most profitable miners are switched on at any given time, and that when a new generation of mining equipment is released, equilibrium is reached very quickly where all miners are operating at a similar cost basis.
| Retail Miner | Chip Fabricator | Weighted Average | |
| Hash Power Share % | 65% | 35% | |
| Discount Level | 0% | 60% | |
| $/GH | 0.047 | 0.019 | 0.037 |
| W/GH | 0.098 | 0.098 | 0.098 |
| $/W | 0.04 | 0.02 | 0.033 |
Table 9 - Rationalised Weighted “Network-Average” Miner
Network Hash rate
As at the date of this report, total network hash rate is 42,587,731,568 GH/s. Miners need to successfully forecast hash rate and difficulty increases when planning future capital expenditure and setting strategy and targets.
Environmental Cost Inputs & Drivers
CAPEX
To better assess the overall impact of the bitcoin mining industry, we should also consider the CO2 emissions from the manufacture and recycling of mining equipment.
A study using data from 200094 suggests that total energy to produce a PC is 895kWh. Although the data is quite dated, it sets a very conservative benchmark, as manufacturing efficiencies consistently improve in line with the laws of competition, alongside Moore & Koomey’s laws discussed earlier.
| Direct Fossil (MJ) | Electricity (kWh) | Total Energy (MJ) | Total Energy (kWh) | |
| Semiconductors | 298 | 170 | 909 | 252.5 |
| Semiconductor manufacturing equipment | 392 | 29.4 | 498 | 138.3 |
| Passive Components | 109 | 10.3 | 146 | 40.6 |
| PCB | 26.7 | 7.71 | 54.5 | 15.1 |
| Bulk Materials | - | - | 770 | 213.9 |
| Silicon Wafers | 0 | 38.1 | 137 | 38.1 |
| Assembly | 35.3 | 51.2 | 220 | 61.0 |
| Transport | 338 | 3.5 | 351 | 97.4 |
| Packaging | 120 | 4.8 | 137 | 38.1 |
| 1319 | 315 | 3222 | 895 |
Table 10 - Energy Required for ASIC manufacture
As 98% of electronic waste is completely recyclable95, and an estimated energy saving of 90% on the recovery of metals and silicon96, we will reduce the “Bulk Materials” energy use by 90%, to result in a total of 703 kWh. Recycling of ASICs is a fair assumption due to the short life of mining equipment, and the value to be extracted out of quickly obsolete equipment through means of recycling.
OPEX
Environmental Impact from operations is effectively pure energy use. If miners are using cheap hydroelectricity to mine, emissions are insignificant. If miners are using dirty coal with no carbon capture, environmental impact is much higher.
It is assumed that the average miner will use power that emits a weighted average value of CO2 based on the world’s energy mix shown in Table 8.
Calculating the Costs
Economic Costs
The following tables shows the outputs from the economic model, which is based on the assumptions set out in the section on Economic Cost Inputs / Drivers . Orange cells are variables / inputs, grey cells are calculation cells.
CAPEX
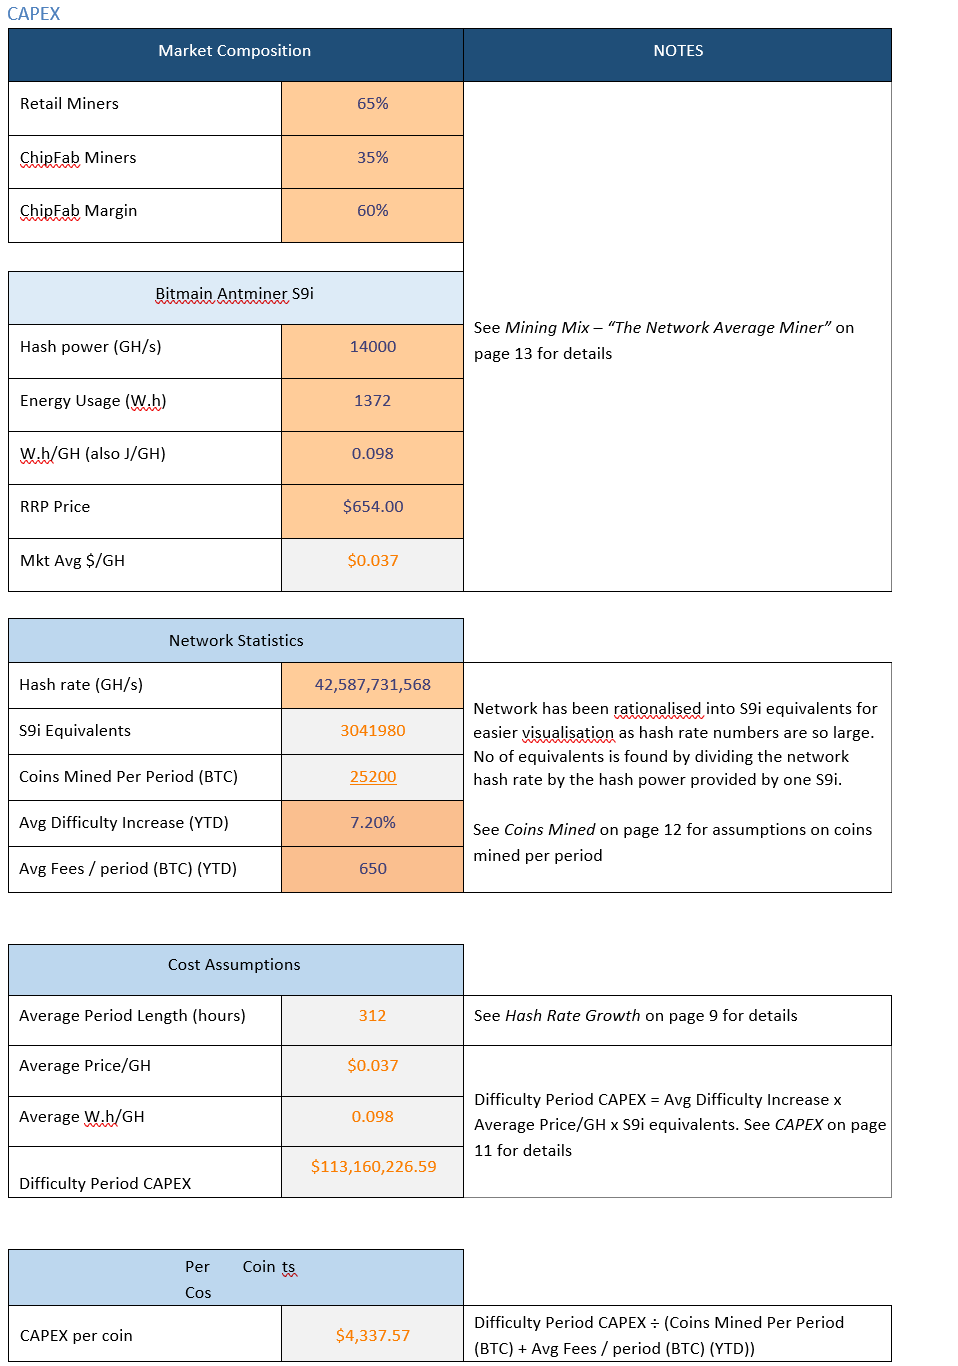 Table 11 - Bitcoin’s Economic Costs - CAPEX
OPEX
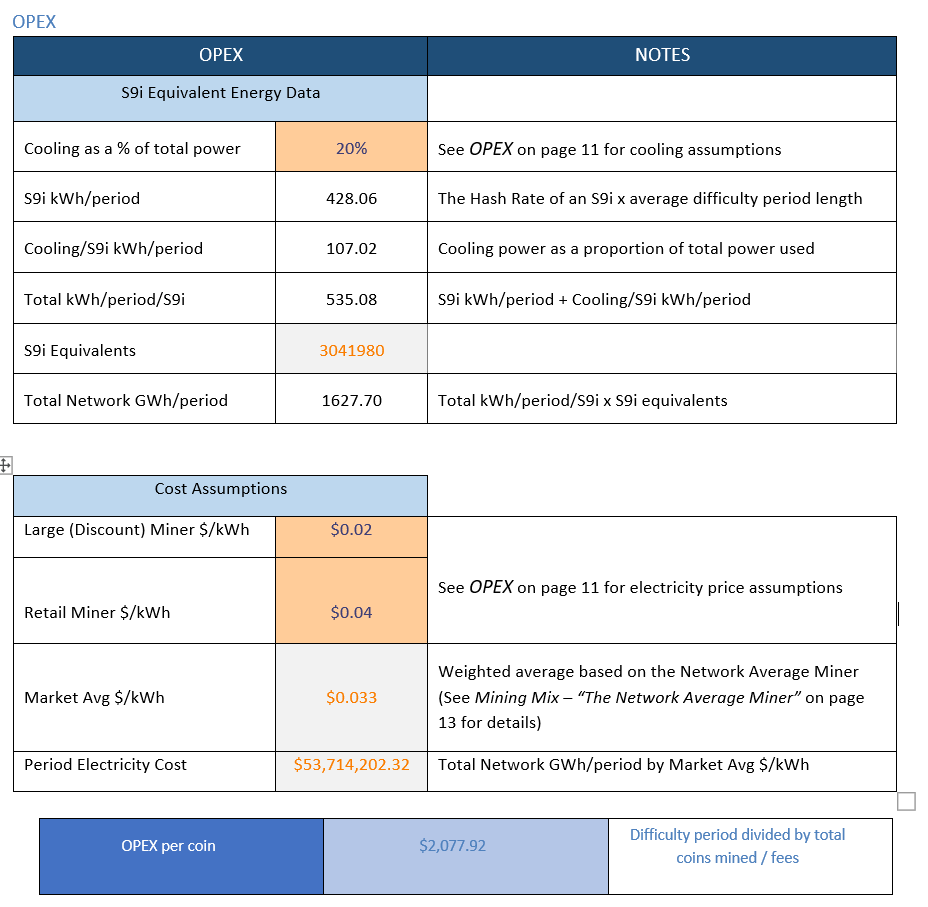 Table 12 - Bitcoin’s Economic Costs - OPEX
Total Cost of a Bitcoin
Adding the CAPEX figure of $4,337.57 to the OPEX figure of $2,077.92 results in a total cost of $6,455.49.
Environmental Costs
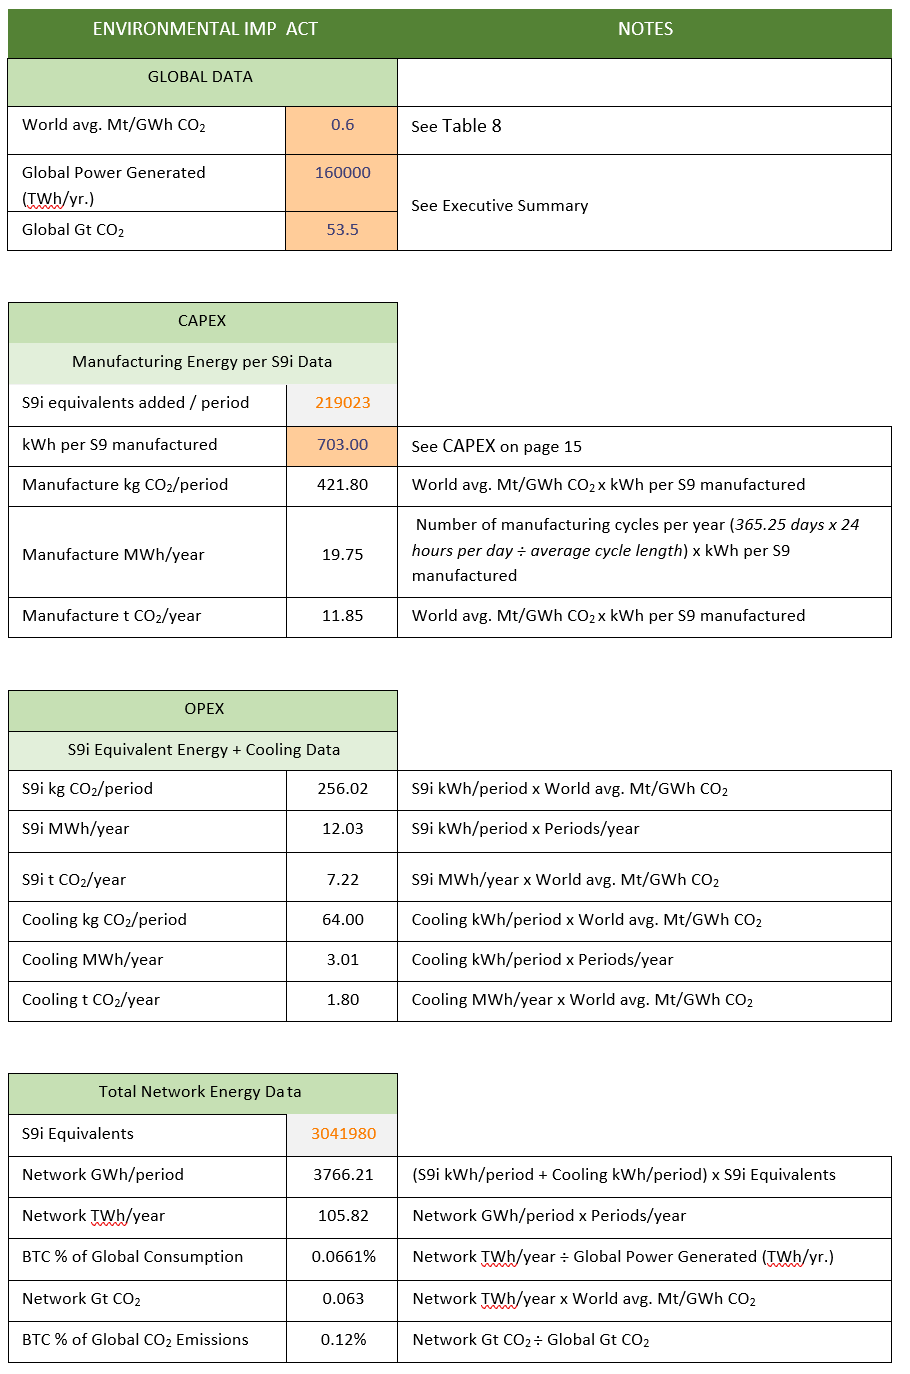 Table 13 - Bitcoin’s Energy Use & Emissions
Environmental Impact Factors
It is unfair to only benchmark Bitcoin’s environmental impact by CO2 emissions alone, so we will assess a few other environmental impacts to compare with the impact of Gold mining.
Eutrophication
Eutrophication, measured in tonnes of Phosphorous equivalents, is the introduction of nutrients into groundwater and other fresh water sources, having a drastic impact on water quality, the local ecology in general, and adverse economic impacts97 . Bitcoin generally has very low externalities, as it relies almost strictly on the electrical grid both to mine and produce hardware. Therefore, to determine the Eutrophication produced by the energy sources that power Bitcoin, based on a weighted world average.
Global Eutrophication stands at 126.6 million tonnes per year98, from a total 150,000 TWh/yr. of global energy produced99, therefore, 1TWh produces about 850 tonnes of PO43- equivalents. As Bitcoin uses around 105TWh/yr., 89,250 tonnes are produced.
Acidification
| Country100 | Acidification (g SO2 eq/kWh) | Energy Mix |
| Turkey | 9.79 | 43.6% Natural Gas, 28.1% Coal, 24.2% Hydro, 4.1% other (71.7% total fossil fuels) |
| Portugal | 1.22 | 22% Coal, 22% Gas, 24% Hydro, 22% Wind, 2% Solar, 6% Biowaste, 2% Oil101 (46% fossil fuels) |
| Spain | 4.93 | 22% Nuclear, 14% Coal, 20% Gas, 6% Oil, 13% Hydro, 18% Wind, 5% Solar, 2% Biofuel101 (40% total fossil fuels) |
| Belgium | 1 | 53% Nuclear, 24% Renewables, 26% Gas, 3% Coal, 0.1% Oil101 (29.1% total fossil fuels) |
| Tanzania | 4.53 | 45% Natural Gas, 42% Hydro, 13% Liquid Fuel102 (58% fossil fuels) |
| Nigeria | 0.22 | 82.2% Biomass & Waste, 10.6% Oil, 6.8% Natural Gas, 0.4% Hydro103 (17.4% fossil fuels) |
| Mexico | 6.59 | 34.45% Natural Gas, 4.89% Coal, 34.83% Oil, 15.75% Gasoline, 7.79% Renewable, 0.78% Nuclear, 1.5% other104 (89.92% Fossil Fuels) |
| Average | 4.04 |
Table 14 - Bitcoin’s Environmental Impact - Acidification
As can be seen from above, countries that have high percentages of Natural Gas in their energy mix contribute greatly to acidification, while Biomass contributes insignificant amounts. Coal & Oil also have large contributions. Since the global energy mix (Table 6) consists of 81.4% fossil fuels (of which 21.6% is Natural Gas), 9.7% Biowaste, and 8.9% Nuclear & Other Renewables, using the average of around 4 g SO2 eq/kWh is appropriate due to the contribution of Biowaste, as well as the above sample countries with high acidification having a disproportionately high use of natural gas compared to the world average. At 78TWh/yr. of energy usage, the Bitcoin Network produces 312,000 tonnes of SO2 equivalents
Ecotoxicity, Carcinogenics, Non-Carcinogenics, and Respiratory Inorganics
Global per-capita data on Ecotoxicity, Carcinogenics, Non-Carcinogenics, and Respiratory Inorganics measures105 are as shown in Table 15. Population statistics106,107,108,109 are also included. All data is as at 2011.
| North America | Europe | Middle East | Eurasia | Asia & Oceania | Africa | Central & South America | |
| Freshwater Ecotoxicity (CTUe) | 2.72E+04 | 1.79E+04 | 3.30E+03 | 1.38E+04 | 5.42E+03 | 1.63E+03 | 1.47E+03 |
| Carcinogenics (CTUh) | 2.67E-04 | 1.48E-04 | 2.36E-05 | 1.28E-04 | 5.20E-05 | 1.70E-05 | 9.54E-06 |
| Non-Carcinogenics (CTUh) | 1.04E-03 | 6.69E-04 | 1.70E-04 | 5.75E-04 | 2.40E-04 | 6.40E-05 | 4.35E-05 |
| Respiratory Inorganics (PM2,5) | 2.66 | 1.26 | 1.29 | 2.46 | 3.72 | 0.199 | 0.443 |
| Population (millions) | 560 | 515 | 145 | 180 | 4,100 | 1,050 | 480 |
Table 15 - Ecotoxicity, Carcinogenics, Non-Carcinogenics, & Respiratory Inorganics Data (per-capita)
When per capita stats are multiplied by population figures, and the totals then divided by world energy generation (~ 150,000 TWh/yr.), then multiplying per 78TWh for energy used on the Bitcoin network, the following is found:
| Freshwater Ecotoxicity (CTUe) | Carcinogenics (CTUh) | Non- Carcinogenics |
| (CTUh) | Respiratory Inorganics (PM2,5) | Population (Billion) | ||||
| Total | 5.21E+13 | 4.88E+05 | 2.13E+06 | 1.85E+10 | 7.04 | |
| Total/TWh | 3.42E+08 | 3.20 | 13.96 | 1.21E+05 | ||
| Bitcoin | 2.66E+10 | 249.73 | 1088.97 | 9.45E+03 |
Table 16 - Bitcoin Ecotoxicity, Non-carcinogenics, Carcinogenics & Respiratory Inorganics
A comparison of these 6 indicators versus that of gold mining and recycling is discussed in the section on
Revisiting Gold on page 22.
Sensitivity Analysis
For the below sensitivity analysis, it is assumed that all aforementioned assumptions in the model are held constant, with one variable being changed at a time to see the impact on overall cost. Four scenarios are demonstrated for each of the 6 variables below, alongside the difference between the modelled cost of $6,455.49.
| Mining Mix* | CAPEX | OPEX | TOTAL | Δ |
| 20/80 Chipfab to Retail | $4,876.28 | $2,266.82 | $7,143.10 | 10.65% |
| 30/70 Chipfab to Retail | $4,543.81 | $2,140.89 | $6,684.69 | 3.55% |
| 40/60 Chipfab to Retail | $4,211.33 | $2,014.95 | $6,226.29 | -3.55% |
| 50/50 Chipfab to Retail | $3,878.86 | $1,889.02 | $5,767.88 | -10.65% |
| Miner’s Margin | CAPEX | OPEX | TOTAL | Δ |
| 30% | $4,959.40 | $2,077.92 | $7,037.32 | 9.01% |
| 40% | $4,765.46 | $2,077.92 | $6,843.38 | 6.01% |
| 50% | $4,571.51 | $2,077.92 | $6,649.43 | 3.00% |
| 70% | $4,183.63 | $2,077.92 | $6,261.55 | -3.00% |
| Electricity Price | CAPEX | OPEX | TOTAL | Δ |
| 1c/2c Chipfab to Retail | $4,377.57 | $1,038.96 | $5,416.53 | -16.09% |
| 1c/3c Chipfab to Retail | $4,377.57 | $1,448.25 | $5,825.82 | -9.75% |
| 2c/5c Chipfab to Retail | $4,377.57 | $2,487.21 | $6,864.78 | 6.34% |
| 3c/5c Chipfab to Retail | $4,377.57 | $2,707.59 | $7,085.16 | 9.75% |
| Cooling Power % | CAPEX | OPEX | TOTAL | Δ |
| 15% | $4,377.57 | $1,955.69 | $6,333.26 | -1.89% |
| 25% | $4,377.57 | $2,216.45 | $6,594.02 | 2.15% |
| 35% | $4,377.57 | $2,557.44 | $6,935.01 | 7.43% |
| 40% | $4,377.57 | $2,770.56 | $7,148.13 | 10.73% |
| Transaction Fees | CAPEX | OPEX | TOTAL | Δ |
| 500 | $4,403.12 | $2,090.05 | $6,493.17 | 0.58% |
| 750 | $4,360.70 | $2,069.91 | $6,430.61 | -0.39% |
| 1250 | $4,278.27 | $2,030.78 | $6,309.05 | -2.27% |
| 1500 | $4,238.21 | $2,011.77 | $6,249.98 | -3.18% |
| Ave Difficulty Change % | CAPEX | OPEX | TOTAL | Δ |
| 5.50% | $3,343.98 | $2,117.88 | $5,461.86 | -15.39% |
| 6.50% | $3,951.97 | $2,097.90 | $6,049.87 | -6.28% |
| 8.50% | $5,167.97 | $2,051.28 | $7,219.25 | 11.83% |
| 9.50% | $5,775.96 | $2,031.30 | $7,807.26 | 20.94% |
-
- a 50/50 ratio should be theoretical maximum, as risk of perception of a 51% attack becomes too high for large miners due to potential catastrophic impact on market price.
Over time, the above sensitivities will allow us to make sense of the model’s results when compared to actual market price and tweak the model in line with new evidence.
Comparative Summary
Revisiting Gold
Since this study has considered the manufacture of ASICs in its evaluation of Bitcoin’s impact, we must now visit the environmental impact of the manufacture of mining equipment to make a like-for-like comparison. To start, we will revisit the subtotal impact of Gold mining considering current production levels. From there, we will add impacts from machinery production to the original tally. Since the previous iteration of this research in 2014 (using 2013 data), World Gold production has increased 18% from 2770 tonnes, to 3270 tonnes in 2017110 . We have also witnessed a sharp drop in the amount of recycled gold produced, going from 37% of total annual production in 2011 produced gold coming from recycled down to only 26% at 1160 tonnes in 2017.
In a very comprehensive study produced by Dell in November 2017111 showed some fascinating information on the relative sustainability of gold mining, and gold recycling. Results are shown in Figure 5 and Figure 6. It should be noted that Dell’s 15 tonne CO2/kg figures for gold mining exclude the construction and demobilisation of mine infrastructure, and site remediation. When including those, the original figure of 20 tonne CO2/kg1 that we used in 2014 was a very fair estimate. Perhaps the best observation to draw from the Dell data is just how toxic and harmful gold mining is to the planet, even though it produces less than half the amount of CO2 per kilo.
Figure 5 - Resource inputs per kilogram of gold recycled
Figure 6 - Environmental comparison of recycling vs mining 1 kilogram of gold
Now that our original assumptions for gold mining have been validated against an in-depth recent study by Dell, we can take a look at how the numbers stacked up in 2017.
| Greenhouse Emissions (t CO2/kg Au) | Energy Consumption (MWh/kg Au) | |
| Rate Per kg - Mining | 20.001 | 48.611 |
| Rate Per kg - Recycling | 37.00111 | 31.32111 |
| Tonnes Produced110 | Greenhouse Emissions (Million t CO2) | Energy Consumption (TWh) | |
| Mined | 3268.7 | 65.374 | 158.9 |
| Recycled | 1160 | 42.92 | 36.34 |
NOTE: All figures have been rationalised into MWh. 1 GJ = 0.27777 MWh. 1 MWh = 3.412 million BTU
Table 17 - Environmental Impact of Gold Mining & Recycling
The next item to assess in the impact of producing mining equipment. To do this, we can look to the world’s largest Gold mining company, Barrick Gold, and the fleet and staff data they provide for their Pueblo Viejo112, Veladero (open-pit)113, and Barrick Nevada (Cortez114, and Goldstrike115 mine operations), which produce 107 tonnes of Gold per year116, or, about 3.3% of total supply. The aggregate of the fleet lists for the above four mines, alongside data on the weight of machinery from manufacturers are shown in Table 19 and Table 18, below. As can be seen, much less machinery is used in an underground environment as opposed to an openpit environment. Fleet data does not include the several hundred regular site-vehicles for staff use on the mine site. With an average of 42 staff per tonne of gold produced at the aforementioned mines, it is assumed that 10% of staff have vehicles for use on site, resulting in an extrapolated figure of around 15,000 site vehicles globally. 11 tonnes of CO2 to produce a vehicle117 means that 165,000 tonnes of CO2 are created. Converting this to a kWh equivalent figure, we divide 0.165 million tonne CO2 by 600 tonnes CO2/TWh (Table 8), resulting in 0.09 TWh equivalent. It is assumed site vehicles will last for 10 years (i.e. 0.009 TWh/year).
| Machine | Make | Qty | Weight (t) | Total Weight (t) |
| R-2000 RoadHeader | Alpine | 1 | 60.00 | 60 |
| 3.5 yd3 Loader | AtlasCopco | 5 | 17.27 | 86 |
| Boltec M Bolter | AtlasCopco | 16 | 21.60 | 346 |
| 120 Grader | Caterpillar | 7 | 16.88 | 118 |
| 414E loader | Caterpillar | 19 | 6.82 | 130 |
| 966 Loader | Caterpillar | 4 | 16.74 | 67 |
| AD30 Truck | Caterpillar | 11 | 30.00 | 330 |
| D4 Dozer | Caterpillar | 12 | 4.93 | 54 |
| R1600G loader | Caterpillar | 14 | 29.80 | 268 |
| DT-20N truck | DUX | 2 | 19.40 | 39 |
| DT-26N truck | DUX | 13 | 25.00 | 325 |
| A64-C/LT/SL Vehicles | Getman | 21 | 12.50 | 75 |
| Mule Pro-DXT Utility Vehicle | Kawasaki | 62 | 0.84 | 52 |
| MHT Telehandler | Manitou | 4 | 24.00 | 96 |
| Rough-Terrain Forklifts (various) | Manitou | 23 | 5.00 | 115 |
| Ultimec MF500 Shotcreter | Normet | 7 | 12.00 | 84 |
| DT721 Tunnelling Jumbo | Sandvik | 11 | 24.50 | 270 |
| Tamrock 1400 Hauler | Sandvik | 8 | 33.70 | 270 |
| Total Weight | 2784 |
Table 18 - Underground Fleet Register for Barrick’s Nevada Mines (Cortex & Goldstrike)
| Machine | Make | Weight | Qty | Total Weight (t) |
| (t) | ||||
| L2350 loader | Komatsu | 72.57 | 2 | 145 |
| Haul Truck, 730E | Komatsu | 146.69 | 19 | 2787 |
| Face Shovel, PC4000 | Komatsu | 362 | 2 | 724 |
| Wheel Loader, WA1200 | Komatsu | 216.4 | 3 | 649 |
| Track Dozer, D375A | Komatsu | 56.29 | 6 | 338 |
| Track Dozer, D85-EX | Komatsu | 28.1 | 1 | 28 |
| Motor Grader, GD825A | Komatsu | 29.68 | 3 | 89 |
| Backhoe, PC300LC | Komatsu | 33.8 | 1 | 34 |
| Backhoe, WB140 | Komatsu | 7.3 | 1 | 7 |
| Wheel Dozer, WD500 | Komatsu | 26.9 | 1 | 27 |
| Wheel Dozer, WD600 | Komatsu | 41.08 | 2 | 82 |
| Water Truck, 330M | Komatsu | 24.04 | 2 | 48 |
| 930E Truck (290t) | Komatsu | 210.19 | 24 | 5044 |
| HM400 Water Truck | Komatsu | 30.3 | 3 | 91 |
| 605 Truck (water) | Komatsu | 46.2 | 6 | 277 |
| 930E Water Truck | Komatsu | 505.75 | 3 | 1517 |
| Face Shovel, PC5500 | Komatsu | 490 | 2 | 980 |
| Backhoe, PC2000 | Komatsu | 204.12 | 1 | 204 |
| P&H 4100 XPB shovel | Komatsu | 1512 | 7 | 10584 |
| P&H 2800 XPB shovel | Komatsu | 1084 | 4 | 4336 |
| Liebherr T282B trucks | Liebherr | 252 | 25 | 6300 |
| Face Shovel, 996 | Liebherr | 676 | 3 | 2028 |
| Drill, SKS 12 | Reedrill | 95.58 | 2 | 191 |
| DrillTech D55SP | Sandvik | 79.33 | 12 | 952 |
| DrillTech D75K | Sandvik | 64.86 | 11 | 714 |
| Drill (Blasthole), D90K | Sandvik | 140.33 | 5 | 702 |
| Sandvik D45KS Drill | Sandvik | 47.73 | 2 | 95 |
| Sandvik DX780 Drill | Sandvik | 14.8 | 2 | 30 |
| Drill, Ranger 700 | Sandvik | 15.2 | 1 | 15 |
| DP 1500 | Sandvik | 19.2 | 2 | 38 |
| Schramm T450GT Drill | Schramm | 21.75 | 1 | 22 |
| PV271 drill | AtlasCopco | 84 | 8 | 672 |
| Flexirock D65 drill | AtlasCopco | 24 | 3 | 72 |
| MD6420 drill | Caterpillar | 95 | 1 | 95 |
| 795F trucks (345 st) | Caterpillar | 202.27 | 30 | 6068 |
| 16H grader | Caterpillar | 24.7 | 16 | 395 |
| 24H grader1 | Caterpillar | 73.34 | 7 | 513 |
| 994F Front-End Loader | Caterpillar | 243.11 | 7 | 1702 |
| D10T Track Dozer | Caterpillar | 70.17 | 20 | 1403 |
| D9T Track Dozer | Caterpillar | 48.99 | 3 | 147 |
| 834H Wheel Dozer | Caterpillar | 47.11 | 7 | 330 |
| 854K Wheel Dozer | Caterpillar | 98.49 | 7 | 689 |
| 777F Haul Truck | Caterpillar | 80 | 13 | 1040 |
| C322 Hydraulic Excavator | Caterpillar | 24.83 | 1 | 25 |
| C336 Hydraulic Excavator | Caterpillar | 30.5 | 3 | 91 |
| 349D Hydraulic Excavator | Caterpillar | 45.83 | 1 | 46 |
| 962 Support Loader | Caterpillar | 19.37 | 2 | 39 |
| 938 Support Loader | Caterpillar | 13.18 | 1 | 13 |
| 785C Haul Truck | Caterpillar | 102.15 | 6 | 613 |
| 6040 Trackhoe | Caterpillar | 397.4 | 1 | 397 |
| 992 Loader | Caterpillar | 94.93 | 5 | 475 |
| 793 Haul Truck | Caterpillar | 122.3 | 46 | 5626 |
| 385 Backhoe | Caterpillar | 84.13 | 1 | 84 |
| 345 Backhoe | Caterpillar | 45.38 | 1 | 45 |
| 988 Wheel Loader | Caterpillar | 43.37 | 4 | 173 |
| 789C / 789D Haul Truck | Caterpillar | 99.12 | 34 | 3370 |
| EX-5500 excavator | HItachi | 518 | 4 | 2072 |
| EX3600 Hydraulic Shovel | Hitachi | 362 | 2 | 724 |
| X1200 Hydraulic Excavator | Hitachi | 112 | 1 | 112 |
| Drill, DMM2 | Ingersoll Rand | 5.4 | 3 | 16 |
Total Weight (tonnes): 66128
Table 19 - Open-pit Fleet Register for Barrick’s Nevada, Pueblo Viejo and Veladero Mines
August 2018 Edition 25
Having precise data on the machinery required to produce 3.3% of the world’s Gold, we will extrapolate the total weights found above (66128 + 2784 = 68,912 tonnes) out to the other 96.7% of the market. This results in almost 2.1 million tonnes of mining equipment, which we will conservatively assume is mostly steel for the next part of the analysis (since the energy needed to extract steel is typically lower than other materials used in vehicles, such as aluminium)118 .
1.95 tonnes of CO2 are emitted in the extraction and production of one tonne of steel119 . Data on vehicle manufacturing shows that the manufacture and transport stages of the vehicles life can vary anywhere from 5 to 20% of the energy required to extract raw materials118 . Therefore, we will say that for each tonne of manufactured and delivered construction machinery there is 2.2 tonnes of CO2 emitted (i.e. 1.95 tonnes + 10%). Multiplying this by 2.1 million tonnes of global Gold mining equipment results in 4.62 million tonnes of CO2 . We will also conservatively say that well maintained mining machinery will last for 10 years if operated 24 hours per day, 365 days per week, resulting in a yearly average emission of 0.462 million tonnes of CO2, or 0.77 TWh equivalent., towards the manufacture of new machinery.
This 210,000-tonne heap of equipment also needs to be packaged and transported each year. While there is no data on emissions from packaging an excavator, estimations can be made regarding transportation emissions. As most mines are remote, equipment must be transported using several modes – by sea to move equipment continentally and then by road. A 3000-kilometre journey is not something unusual and would even be considered very conservative considering where the major equipment manufacturers are based, and how remote these mines truly are. We will assume that 75% of the journey happens via sea freight, and 25% of the journey via truck transport. This results in 4.725 billion tonne-km by sea, and 1.575 billion tonne-km by road. With sea travel on a large container barge producing 19.6 g/CO2 per tonne-kilometre, and 62 grams for road travel120, this results in 190,000 tonnes of CO2, or 0.114 TWh equivalent.
Therefore, the total amount of energy needed to manufacture and deliver machinery to the mines is 0.77 TWh for manufacture of machinery, 0.009 TWh for site vehicles, 0.0114 TWh for transport, which equals 0.7904 TWh, or, 0.474 million tonnes of CO2 . Adding this to mining and recycling totals shown in Table 17, we have the following:
| Tonnes Produced110 | Greenhouse Emissions (Million t CO2) | Energy Consumption (TWh) | |
| Mined | 3,268.7 | 65.374 | 158.9 |
| Recycled | 1,160 | 42.92 | 36.34 |
| Equipment | 2,100,000 | 0.474 | 0.7904 |
| Total | 108.768 | 196.09 |
Table 20 - Gold’s Environmental Impact - Energy Use & Emissions
Comparison of Yearly Energy Use
Looking at the table below, it appears that Bitcoin uses a substantial amount of energy – now closing in on the entire Gold industry, and due to its reliance on the electrical grid, CO2 emissions are high. As the electric grid moves towards renewable energy sources, Bitcoin’s figures for CO2 emissions will continue to improve, however there will be little improvement in the gold mining industry. That said, Bitcoin’s energy use will continue to grow in line with the Network’s computing power growth, and will most likely eclipse the Gold Industry within this decade.
Another interesting statistic is that more energy goes into building Bitcoin hardware than goes to producing the world’s gold mining equipment. But since a large part of ASIC manufacture is tied to the electrical grid (Table 10), Bitcoin’s emissions proportional to its energy use will reduce
| Energy Used (kWh) | Tonnes CO2 Produced | Emission-Per-Unit Trend | |
| Gold Mining + Equipment | 159.69 million | 65.85 million | Increasing |
| Gold Recycling | 36.34 million | 42.92 million | Decreasing |
| Bitcoin Mining | 105.82 million | 63 million | Decreasing |
Table 21 - Bitcoin vs. Gold - Emissions & Energy Use
Comparison of Other Environmental Indicators
As can be seen below, Bitcoin is dramatically less harmful than Gold on all indicators aside from Carcinogenics, where the Global Electric Grid, i.e., the sole unified entity powering the Bitcoin network, spews more than double that of the Gold industry. As the electric grid moves towards renewable energy sources, Bitcoin’s figures will continue to improve quite dramatically, however there will be little improvement in the gold mining industry.
| Gold Mining | Gold Recycling | Total Gold (tonnes) | Bitcoin | Δ | |
| kg Produced | 3268700 | 1160000 | 4428.7 | ||
| Acidification (kg SO2 /kg) | 175 | 180 | 780823 | 423265 | -45.8% |
| Eutrophication (kg PO43- /kg) | 4095 | 175 | 13588327 | 89944 | -99.3% |
| Freshwater Ecotoxicity (CTUe/kg) | 22139602 | 154278 | 7.25E+10 | 3.61E+10 | -50.2% |
| Carcinogenics (CTUh/kg Au) | 0.03208 | 0.00171 | 107 | 339 | 217.1% |
| Non-Carcinogenics (CTUh/kg) | 0.93 | 0.01 | 3051 | 1477 | -51.6% |
| Respiratory Inorganics (PM2,5/kg) | 20 | 12 | 79294 | 12817 | -83.8% |
Table 22 - Bitcoin vs. Gold - Broad Environmental Impact
Discussion & Conclusion
There is no doubt that the Bitcoin Network uses large amounts of energy (yes, it uses more power than the country of Ireland121), however, as alluded to in the Foreword, this energy is necessarily required to effectively turn electricity or power into “money”. While emissions are high, this is due to the composition of the world’s energy grid, and over time, emissions will continue to reduce proportionately to the amount of power that has been used.
Some critics have labelled Bitcoin as an environmental disaster121, however it has been demonstrated that Bitcoin is dramatically less harmful to the environment than the gold mining industry when other key environmental indicators are assessed. Others have made the very fair criticism that costs per transaction are unruly122, especially when volume of transactions (about 7 per second123) is considered in the context of the total power being used by the network. This criticism is only temporarily fair, as the Lightning Network124, which has been live and growing since March 2018, will significantly increase transaction capacity without increasing energy consumption. The Lightning Network, as of July 31, 2018, has over 2700 nodes, 7700 channels, and a network capacity of about 93 BTC125 (note, this is growth of almost 10% in node count, almost 30% in channel count, and over 30% in BTC capacity a period of only two weeks). In fortnight before that (July 1 to July 14), node-count increased over 10%, channel count by 30%, and network capacity more than tripling. It may not be unrealistic to expect a Bitcoin / Lightning Network that can process several hundred near-feeless transactions per second by the end of 2019, and potentially several thousand by the end of 2020. This would effectively allow Bitcoin to scale its transactional capacity by several orders of magnitude ahead of the next price hype-cycle.
As Bitcoin’s market capitalisation grows, let’s say two orders of magnitude to bring it in line with Gold’s $7 trillion-dollar market cap, the Bitcoin mining industry will start to drive innovation in the world’s electrical generation market due to the sheer amount of energy that the network will demand. Judging by current profits that mining hardware manufacturers currently make, mining companies may even become large enough to vertically integrate and acquire energy companies, and to remain competitive, the energy will need to be very cheap which means a high likelihood of migrating to hydroelectricity, and other renewables that get cheaper by the kWh every year.
We have also presented some broad assumptions about the composition of the Bitcoin mining market, and the dynamics at play that affect the cost to mine a coin. As the industry grows by a magnitude or two and becomes more competitive, the market price of a bitcoin will start becoming more correlated with the cost to mine, just as is the case for traditional commodity producers.
References
- McCook, H. 2015, “An Order-of-Magnitude Estimate of the Relative Sustainability of the Bitcoin Network”https://www.academia.edu/7666373/An_Order - of -Magnitude_Estimate_of_the_Relative_Sustainability_of_the_Bitcoin_Network_ - 3rd Edition
- The World Bank, “Total greenhouse gas emissions (kt of CO2 equivalent)”,https://data.worldbank.org/indicator/EN.ATM.GHGT.KT.CE?view=chart , (accessed 21 July 2017).
- Janssens-Maenhout, G. et al, 2017, “JRC Science for Policy Report”http://edgar.jrc.ec.europa.eu/booklet2017/CO2_and_GHG_emissions_of_all_world_countries_booklet_online.pdf (accessed 21 June 2018)
- Kilvert, N., 2017, “Paris agreement slipping away as record global CO2 emissions predicted for 2017”,http://archive.li/zpYnW
- International Energy Agency, 2017, “Key World Energy Statistics”,http://archive.is/PFlG3
- Shapiro, C., Varian, H. (1999) “Information Rules – a strategic guide to the network economy” Boston, Harvard Business School Press 184
- Scholte, J. “Global Capitalism and the State”, _International Affairs_3 427-452 (1997) doi: 10.2307/2624266
- Stiglitz, J (2006) “The Price of Inequality”, New York, W.W. Norton & Company 157-170 (accessed 26 February 2016) http://resistir.info/livros/stiglitz_the_price_of_inequality.pdf (21:24)
- Stiglitz, J. (2010) “Freefall – America, Free Markets, and the Sinking of the World Economy”, New York, W. W. Norton & Company 74-86
- Schumpeter, J A. (2003) [1943] “Capitalism, Socialism and Democracy”, London, Routledge 83
- Nakamoto, S. “Bitcoin: A Peer-to-Peer Electronic Cash System.” No Publisher (2008) https://bitcoin.org/bitcoin.pdf , 19
- McKinsey & Co (2015) “Global Payments 2015: A Healthy Industry Confronts Disruption” (accessed 26 February 2016) http://www.mckinsey.com/~/media/McKinsey/dotcom/client_service/Financial%20Services/Latest%20thinking/Payme nts/Global_payments_2015_A_healthy_industry_confronts_disruption.ashx (22:44)
- Utterback, J. M. (1994) “Managing the Dynamics of Innovation. 1st edition” Cambridge: Harvard Business School Press 145-166
- Berners-Lee, T. “Long Live the Web”, Scientific American 303 80-85 (2010) doi: 10.1038/scientificamerican1210-80
- Müller, R., Kiji, B., Martens, J. “A Comparison of Inter-Organizational Business Models of Mobile App Stores: There is more than Open vs. Closed”, Journal of theoretical and applied electronic commerce research 2 63-76 (2011) doi:10.4067/50718-18762011000200007
- Lerner, J., Tirole, J. “The open source movement: Key research questions”, _European Economic Review_4-6 819826 (2001) doi: 10.1016/S0014-2921(01)00124-6
- Bitcoin Wiki, “Difficulty”, (accessed 27 February) (accessed 27 February 2016) https://en.bitcoin.it/wiki/Difficulty (21:33)
- Bitcoin Wiki, “Controlled Supply”, (accessed 27 February) https://en.bitcoin.it/wiki/Controlled_supply (21:33)
- Hines, J., Rice, E. “Fiscal Paradise: Foreign Tax Havens and American Business”, _The Quarterly Journal of Economics_1 149-182 (1994) doi: 10.2307/2118431
- United Nations (2009), “Human Development Report 2009 – Overcoming barriers: Human mobility and development”, New York, UNDP 2-3
- Plamer, D. (2015) “11 Bitcoin Startups That Went Bust in 2015”, (accessed 26 February 2016) http://www.coindesk.com/bitcoin - startup - shut - down - 2015/ (20:25)
- Parker, L. (2015) “36 bitcoin exchanges that are no longer with us”, (accessed 26 February 2016) http://bravenewcoin.com/news/36 - bitcoin - exchanges - that - are - no - longer - with - us/ (20:26)
- Perez, Y. (2015) “Mt Gox: The History of a Failed Bitcoin Exchange” (accessed 26 February 2016) http://www.coindesk.com/mt - gox - the - history - of - a - failed - bitcoin - exchange/ (20:27)
- Greenberg, A. (2013) “End of The Silk Road: FBI Says It’s Busted The Web’s Biggest Anonymous Drug Black Market”, Forbes, (accessed 26 February 2016) http://www.forbes.com/sites/andygreenberg/2013/10/02/end - of - the - silk - road fbi - busts - the - webs - biggest - anonymous - drug - black - market/#103e7805347d (20:28)
- Urquhart, J. (2014), “Russian authorities say Bitcoin illegal”, Reuters, (accessed 26 February 2016) http://www.reuters.com/article/us - russia - bitcoin - idUSBREA1806620140209 (20:29)
- US Marshalls Service (2015), “USMS Asset Forfeiture Sale”, (accessed 26 February 2016) http://www.usmarshals.gov/assets/2015/dpr - bitcoins/ (20:30)
- Higgins, S. (2015), “SEC Charges GAW Miners CEO Josh Garza With Securities Fraud”, (accessed 26 February 2016) http://www.coindesk.com/gaw - faces - ponzi - scheme - charges - from - sec/ (20:31)
- Rizzo, P (2016), “Making Sense of Bitcoin’s Divisive Block Size Debate” (accessed 26 February 2016) http://www.coindesk.com/making - sense - block - size - debate - bitcoin/ (20:32)
- Hajdarbegovic, N. (2014) “Bitcoin Miners Ditch GHash.io Pool Over Fears of 51% Attack” (accessed 26 February 2016) http://www.coindesk.com/bitcoin - miners - ditch - ghash - io - pool - 51 - attack/ (20:33)
- Pseudonymous (Bitcoin Brother), Pseudonymous (sapiophile) (2015) “Bitcoin Price Chart with Historic Events”(accessed 26 February 2016) https://bitcoinhelp.net/know/more/price - chart - history (20:34)
- Nassim Taleb, N., 2012, “Anti-fragile: Things that gain from disorder”, New York, Random House
- info, Bitcoin Market Price (USD), (accessed 26 February 2016) https://blockchain.info/charts/market price?timespan=all&showDataPoints=false&daysAverageString=1&show_header=true&scale=0&address = (20:35)
- info, “Blockchain charts - Various bitcoin charts and currency statistics” (accessed 26 February 2016) https://blockchain.info/charts (20:36)
- Parkin, M. (2014) “Microeconomics – 11th Edition”, New York: Pearson 272-296
- Mankiw, N. (2011) “Principles of Economics – 6th Edition”: South-Western Cengage 291- 314
- Makowski, L., Ostroy, J. “Perfect Competition and the Creativity of the Market”, Journal of Economic Literature, Vol.XXXIX (June 2001) 479-535
- Stiglitz, Joseph E.;Walsh, Carl E. (2006). “Economics (4th ed.)”, New York: W.W. Norton & Company 205-222
- Dean, J. (1951) “Managerial Economics” New York: Prentice Hall
- Semulson, W., Marks, J. (2012) “Managerial Economics 7th edition”, New York: John Wiley & Sons 283-318
- Bitcoin Wiki, “Transaction Fees”, (accessed 27 February) https://en.bitcoin.it/wiki/Transaction_fees (21:33)
- Wile, R. (14 June 2014) “Today, Bitcoin’s Doomsday Scenario Arrived” (accessed 26 February 2016),http://www.businessinsider.com.au/today - bitcoins - doomsday - scenario - arrived - 2014 - 6?r=US&IR=T ,(21:37)
- Pagliery, J. (2015) “Record $1 billion invested in Bitcoin firms so far”, (accessed 26 February 2016) http://money.cnn.com/2015/11/02/technology/bitcoin - 1 - billion - invested/ (21:38)
- Geroski, P. “The Evolution of New Markets”, Oxford University Press Scholarship Online, 61-100 (2003) doi:10.1093/0199248893
- Washbourne, M. “Diversified Miners Are Best Bet”, Australia’s Paydirt, 1.217 40 (2014)
- Guez, G. “Just 8 percent of Americans are invested in cryptocurrencies, survey says”http://archive.is/Mmvqh
- US Census Bureau, Quick Facts (Accessed 11 June 2018),https://www.census.gov/quickfacts/fact/table/US/PST045217
- Hahm, M. “16.3 million Americans buy and sell bitcoin frequently” (accessed https://finance.yahoo.com/news/16 - 3 million - americans - buy - sell - bitcoin - frequently - html
- Coinbase, About Page (accessed 11 June 2018) http://archive.is/3xPpy
- Statista, “Share of consumers using cryptocurrency as a payment method every day in Europe as of 2016, by country”,http://archive.li/czwvf
- net, “World Population Pyramids”,http://archive.li/Bq9va
- Hileman, G., Rauchs, M. “Global Cryptocurrency Benchmarking Study”, Centre for Alternative Finance, University of Cambridge, pp 10,http://archive.is/eKjmR
- BitcoinRichlist, “Top 100 Richest Wallet Balances (Dec 2014)”http://archive.is/yECCV
- BitcoinRichlist, “Top 100 Richest Bitcoin Addresses” (June 2018),http://archive.is/Fx3K0
- Bansal, D. “Bitcoin Data Science (Pt. 1): HODL Waves”http://archive.is/l7atC
- Fraunhoffer Institute (2013) “Levelized Cost of Electricity – Renewable Energy Technologies” (accessed 26 February 2016)http://archive.fo/0KPll
- Ellerman, A., Convery, F., de Perthuis, C. (2010) “Pricing Carbon – The European Union Emissions Trading Scheme”, Cambridge, Cambridge University Press 85-122
- Afuah, A. (1998) “Innovation Management: Strategies, Implementation and Profits - 1st edition” Oxford: Oxford University Press. 13-46
- Johnson, G., Scholes, K., Whittington, R. (2008) “Exploring Strategy- 8th Edition”, Essex: Pearson 59-6759 Henderson, B. (1976) “The Rule of Three and Four”, s.l.: Boston Consulting Group.
- Sheth, J. N., Sisodia, R. S. (2002) “Competitive Markets and the Rule of Three”, London, Ontario, Canada: Ivey School of Business.
- Pareto, V. (2014) “Manual of Political Economy”, Oxford: Oxford University Press62 Blockchain.info, “Bitcoin Hash rate Distribution”, http://archive.fo/jPsCb
- Deaton, A., Laroque, G. “Competitive Storage and Commodity Price Dynamics”, _Journal of Political Economy_5 896-923 (1996)
- Kilian, L. (2006) “Not All Oil Price Shocks are Alike: Disentangling Demand and Supply Shocks in Crude Oil Markets” CERN Discussion Paper No. 5994 1-57
- Mackey, M. “Commodity price fluctuations: Price dependent delays and nonlinearities as explanatory factors”, _Journal of Economic Theory_2 497-509 (1989) doi: 10.1016/0022-0531(89)90039-2
- Colangelo, G. “Vertical vs. Horiztonal Integration: Pre-emptive Merging”, _The Journal of Industrial Economics_3 323-327 (1995) doi: 10.2307/2950583
- Bitmain “Antminer S9i-14TH/s”,https://shop.bitmain.com/?lang=en ,(accessed 31 July 2018)
- Canaan Creative, 2018, “Avalon 8 Series (Qty 40)- Shipping now Best value”http://archive.is/SkBgK
- info, 2018, “Hashrate”,https://blockchain.info/charts/hash - rate (accessed 14 June 2016)
- Hruska, J., 2013. “ Intel’s former chief architect: Moore’s law will be dead within a decade” http://archive.is/9WNf8
- Koomey, J. et al., 2010. Implications of Historical Trends in the Electrical Efficiency of Computing. _IEEE - Annals of the History of Computing,_33(3), pp. 46-54.
- Johnson, P., Marker, T., 2009, “Data Centre Energy Efficiency Product Profile”,http://archive.li/ng9MO
- Song, Z., Zhang, X., Eriksson, C., 2015. “Data Center Energy and Cost Saving Evaluation”http://archive.is/sEH60
- Ni, J., Bai, X., 2016, “A review of air conditioning energy performance in data centers”, Renewable and Sustainable Energy Reviews, Volume 67 https://www.researchgate.net/publication/308343722_A_review_of_air_conditioning_energy_performance_in_data_c enters ( accessed 22 June 2018)
- ABC News, 2018, “Iceland will soon use more energy mining bitcoins than powering its homes”,http://archive.is/qW31p
- Malkin, S., 2018, “The Cheapest (and Best) Places for Bitcoin Mining”,https://cryptocurrencynews.com/daily news/mining/cheapest - places - mining - bitcoin/ (accessed 22 June 2018)
- info,2018, “Total Transaction Fees”,http://archive.is/ct1ZY
- International Energy Agency, 2017. “Key World Energy Statistics”http://archive.is/gYYIw
- Sovacool, B. K., 2008. “Valuing the greenhouse gas emissions from nuclear power: A critical survey.” _Economic Policy,_Volume 36, p. 2950. http://archive.is/EaI5W
- Moomaw, W. et al., 2011. Annex II: Methodology. In IPCC: Special Report on Renewable Energy Sources and Climate Change Mitigation, Geneva: IPCC.
- Lazard, 2017. “Levelized Cost of Energy 2017”http://archive.is/UwOJA
- Asciento, R. & Lawrence, A., 2013. Will energy prices power US datacenter growth or short-circuit energy efficiency? http://archive.is/RFrKU
- Meyer, D. 2018, “Mining a Bitcoin Costs About as Much as Buying One These Days”http://archive.is/flVWv
- Huang, Z. 2018, “This could be the beginning of the end of China’s dominance in bitcoin mining”http://archive.is/DWBla
- Clenfield, J. & Alpeyev, P., 2014. “The Other Bitcoin Power Struggle”http://archive.li/n8qT2
- com, 2018, “Semiconductors Industry Profitability”,http://archive.is/M0XV8
- com, 2018, “Computer Hardware Industry Profitability”,http://archive.is/eqTiw
- Genesis Mining, 2018, “Homepage”,https://www.genesis - com/ (accessed 14 June 2018)
- Genesis Mining, 2018, “Pricing”,https://www.genesis - com/pricing (accessed 14 June 2018)
- Genesis Mining, 2018, “Customer Service”,https://www.genesis - com/customer - service (accessed 14 June 2018)
- Malwa, S. 2018, “Bitmain Considers Billion Dollar IPO after Expansion in Other Sectors”http://archive.li/IzFkq
- Schmidt, B. 2018, “Crypto’s 32-Year-Old Billionaire Mining King Is Mulling an IPO”https://archive.li/v5uXk
- Cheng, E. 2018, “Secretive Chinese bitcoin mining company may have made as much money as Nvidia last year”http://archive.is/mm1qg
- Williams, “Energy intensity of computer manufacturing: hybrid assessment combining process and economic inputoutput methods,” Environ Sci and Technol, vol. 38, 2004, pp. 6166-6174.
- Australian Bureau of Statistics, 2013, “Waste Account, Australia, Experimental Estimates, 2013 – Electronic and Electrical Waste”,http://archive.is/EZHST
- Zhang, K., Schnoor, J., Zeng, E., 2012, “E-Waste Recycling: Where Does it Go from Here?”, Environment, Science, Technology, Vol 46, pp 10861-10867,http://cedar - ca/pdf/E - Waste_Recyling.pdf (accessed 20 June 2018)
- Smith, V., 2003, “Eutrophication of Freshwater and Coastal Marine Ecosystems: A Global Problem”, Environmental Science & Pollution Research, Volume 10, Issue 2, pp 126-139, https://pdfs.semanticscholar.org/057e/8da9c04b59091046e1482828760472713e30.pdf
- World Resources Institute, 2009, “Sources of Eutrophication (Table 2)”,http://archive.is/9vbx6
- International Energy Agency, 2012, “Key World Energy Statistics”,http://archive.is/Wxlr5
- Günkaya, Zerrin & Özdemir, Alp & Özkan, Aysun & Banar, Müfide. (2016). “Environmental Performance of Electricity Generation Based on Resources: A Life Cycle Assessment Case Study in Turkey”. Sustainability. 8. 1097.10.3390/su8111097. http://www.mdpi.com/2071 - 1050/8/11/1097/pdf
- International Energy Agency, “Member Countries”,http://archive.is/ArM1y
- com, “Tanzania Energy Profile”,https://www.tanzaniainvest.com/energy (accessed 6 July 2018)
- Energypedia, “Nigeria Energy Situation”,http://archive.is/z2lCF
- Energypedia, “Mexico Energy Situation”,http://archive.fo/PGgM4
- Laurent, A., Espinosa, N., 2015, “Environmental impacts of electricity generation at global, regional and national scales in 1980-2011: What can we learn for future energy planning?”http://www.rsc.org/suppdata/ee/c4/c4ee03832k/c4ee03832k1.pdf
- Population Reference Bureau, 2011, “2011 World Population Data Sheet”https://assets.prb.org/pdf11/2011population - data - pdf
- Worldometers, 2018, “World population by Year”,http://archive.fo/ACK7O
- OECD, 2013, “OECD Eurasia Competitiveness Programme”,http://www.oecd.org/global relations/Eurasia%20brochureweb.pdf
- Eurostat, 2011, “2011 Census”,http://archive.fo/wTjW1
- World Gold Council, 2013 - 2018, “Gold Demand Trends”,http://archive.li/ioBTj
- Dell, 2017 “Environmental Net Benefit of Gold Recycling”http://archive.is/UgzhS
- Barrick Gold Corporation, 2018 “Technical Report on the Pueblo Viejo Mine, Sanchez Ramirez Province, Dominican Republic”, pp 16-18 (Table 16-9)
- Barrick Gold Corporation, 2018 “Technical Report on the Veladero Mine, San Juan Province, Argentina”, pp 16-23 (Table 16-11)
- Barrick Gold Corporation, 2016 “Technical Report on the Cortez Joint Venture Operations, Lander and Eureka Counties, State of Nevada, U.S.A”, pp 16-14 (Table 16-6)
- Barrick Gold Corporation, 2017 “Technical Report on the Goldstrike Mine, Eureka and Elko Counties, State of Nevada, U.S.A”, pp 16-5 (Table 16-2), pp 16-13 (Table 16-8)
- Barrick Gold Corporation, 2018, “Annual Report – 2017”,https://barrick.q4cdn.com/808035602/files/annual report/Barrick - Annual - Report - pdf (accessed 16 June 2016)
- Li, S., Li, N., Li, J., Gao, Y., 2012, “Vehicle Cycle Energy and Carbon Dioxide Analysis of Passenger Car in China”, 2012 AASRI Conference on Power and Energy Systems
- Klocke, F. et al, “Simplified Life Cycle Assessment of a Hybrid Car Body Part”, 21st CIRP Conference on Life Cycle Engineering, https://ac.els - cdn.com/S221282711400479X/1 - s2.0 - S221282711400479X - main.pdf? tid=b0a3ffbd - fcb1 4da1 - b3db - 6e5c64c1bdb4&acdnat=1529169975_cf97c708ac6e9f9292741e2de1a7fe71
- De Wolf, C. et al, 2017, “Measuring embodied carbon dioxide equivalent of buildings: A review and critique of current industry practice”, Energy and Buildings, Volume 140, pp 68-80
- European Chemical Transport Association, 2011, “Guidelines for measuring and managing CO2 emission from Freight Transport Operations”,http://archive.is/w4SLX
- Carstens, A., 2018, “Money in the Digital Age: what role for Central Banks?”, Bank for International Settlements
- Digiconomist, 2018, “Bitcoin Energy Consumption Index”,https://digiconomist.net/bitcoin - energy consumption#assumptions (accessed 13 July 2018)
- Bitcoin Wiki, 2014, “Maximum Transaction Rate”,http://archive.fo/cEbfv
- network, 2018, “Lightning Network – Scalable, Instant Bitcoin/Blockchain Transactions”,http://archive.fo/ggPPy
- Lightning Network Explorer, 2018,https://lnmainnet.gaben.win (accessed 31 July 2018)
The Bitcoin Second Layer
By Nik Bhatia
Posted August 7, 2018
- 1/4 The Bitcoin Second Layer
- 2/4 The Time Value of Bitcoin
- 3/4 The Bitcoin Risk Spectrum
- 4/4 The Lightning Network Reference Rate

Bitcoin’s antifragile protocol and its exponentially increasing network effects make it a behemoth, gradually swallowing up global economic activity. The latest of these network effects is a second layer protocol called Lightning Network, which uses bitcoin’s base layer protocol as its security. The concept of layered money is not new in monetary history. In this writing, I’ll be using gold as an analogy to describe why bitcoin will evolve in layers on its way to world reserve currency status.
Layered Money
Gold has served as money for millennia due to its unique chemical properties and its global network effects. But gold has not acted as money only in its raw physical form, or on its first layer. Gold is a perfect example of how a layered money system evolves. Let’s take a look at gold as money in a four layered example. I’ll describe the rule set, or protocol, of each gold layer so the reader can imagine similarities to bitcoin’s layered protocol approach.
The first layer of gold is the physical gold in its raw form after it is mined: gold nuggets. The protocol of gold’s base layer has only one rule. The element must adhere to the properties of the periodic table’s 79th element. If it does, it is gold; if it does not, it is not gold. Consensus around this “79th element” protocol is millennia old.
The second layer of gold is raw gold that has been melted and shaped into bars and coins following a standardized protocol of purity, weights, and measures. Mints can be controlled by governments or by private enterprise, but the coinage will only be considered money by users if the “79th element” first layer protocol is followed.
The third layer of gold is gold certificates. These are claims issued by banks that have taken gold on deposit. Third layer banks will only use gold coins and bars that follow the consensus second layer protocol of purity, weights, and measures and only from mints that are properly following the “79th element” protocol. These certificates can act as money but carry counterparty risk of the issuer.
The fourth layer of gold is certificates backed by bank-issued gold certificates. A liquidity provider can issue these certificates, which would require several layers of trust by the user. Somebody accepting fourth layer gold as money has to trust that the liquidity provider has real gold certificates, which are backed by physical gold at a bank that follows a standardized purity for gold deposits.
Each layer uses the layer beneath it for consensus and security. Money will always see a multiple layered expansion as it evolves, and each layer has costs and benefits. You can mine your own gold, but this process is very expensive with a high barrier to entry. You can buy gold coins and bars easily in most parts of the world, but using them for day to day commerce is unfeasible. As a merchant, you can accept gold coins but either have to trust the purity or assay the gold yourself. Once you’re using the paper certificate layers, you now are engaged in counterparty risk, but have easier capacity for transactions. Each layer serves a different function. Base layers are for final settlement, while higher layers are for facilitation of economic activity.
Bitcoin’s First Layer
Bitcoin’s first layer, or base layer, is a protocol proposed in 2008 that has reached a global state of consensus as it approaches its tenth birthday. Bitcoin’s unit of account, also called bitcoin, has exchange rates with currencies around the world in markets that are growing in depth and liquidity. The protocol itself has added vital updates in its young life that have strengthened both security and usability. The network’s uptime and its ability to prevent double spends are relentless.
Critics of bitcoin often incorrectly identify a feature of bitcoin, its slow speed, as a flaw. Bitcoin’s confirmation process is meant to be slow because of security reasons. The intent of bitcoin is censorship-resistant, scarce digital cash, not a speedy payments solution. The best way to think about bitcoin’s base layer protocol is as a final settlements layer. The final settlement of physical gold is also a slow, clunky, and expensive process. Imagine, for example, companies in different parts of the world settling large balances of gold by loading ships with physical gold bars and sailing fortunes hundreds of miles across seas. Not only is the delivery an arduous process, but the verification process is also quite a task. In theory, every single piece of metal would have to be tested for purity. This process should be considered as historical context for what is required to have true final settlement of scarce money. The energy consumption required to find valid blocks has dramatically increased over time which increases security, but difficulty adjustments ensure bitcoin still averages six blocks per hour.
Centralization and attack vulnerability, while both permanent concerns to owners of bitcoin, have not prevented huge sums of capital to be stored in bitcoin’s denomination. The denomination, commonly known as BTC, despite its commonly quoted exchange rates with fiat currencies, stands alone as a final settlement asset. With a secure and reliable final settlement layer firmly in place, development of higher layers can ensue: enter the Lightning Network.
Bitcoin’s Second Layer
Lightning Network is a second layer protocol on top of bitcoin. The protocol uses bitcoin as its native denomination, meaning that Lightning can only be used by those with real bitcoin. Under the hood, Lightning Network is a web of bidirectional payment channels, but the protocol’s functionality is beyond the scope of this writing. The important takeaway is that Lightning allows for the instantaneous transfer of bitcoin from peer to peer with one considerable difference from the first layer: channel balances can adjust but do not require immediate settlement on the base layer. Simply stated, Lightning transactions are unsettled bitcoin transactions.
Having unsettled bitcoin comes with risk, however. Bitcoin held in Lightning Network payment channels can be stolen by malicious actors if node operators are not properly monitoring the channels and the base layer. Malicious actors have a strong disincentive to steal, however, as fraudulent activity gives the victim ability to sweep all funds from the channel. Now that we have covered some of Lightning Network’s basics, let’s take a look at the importance and the significance of this new layer on top of bitcoin.
The Importance of Lightning
Firstly, the Lightning Network is a zero sum, fully reserved routing network. You may only use Lightning if you bring in real bitcoin, and all routing fees earned by liquidity providers are paid for by liquidity consumers. This allows Lightning Network to operate with one of the primary features of bitcoin, its limited supply.
Secondly, Lightning does not carry the burden of base layer confirmation. This allows for bitcoin to be exchanged ad infinitum without consuming precious block space. Lightning nodes can decide to take final settlement of their bitcoin by broadcasting the correct state of a payment channel to the base layer at any time, but they don’t have to.
Lastly, Lightning transactions can be interpreted as financial agreements, making Lightning Network a capital market layer. The network’s structure is built as a market for capital and liquidity. Bitcoin can now instantaneously fly around the world without having to wait an hour for final settlement. The two core components to any financial transaction, time value and risk premium, can be derived from Lightning transactions. Opportunity cost tradeoffs can be calculated, and bitcoin can be leased on a short term basis to the network without surrendering one’s private keys. With gold, there is no way to accrue positive interest on capital without surrendering the physical metal. This makes Lightning Network an absolute game changer for the entire concept of capital markets: income without explicit counterparty default risk.
Conclusion
Bitcoin is often referred to as digital gold, but I’ll propose a more specific analogy. Bitcoin’s base layer is like digital physical gold, while Lightning Network is like digital paper gold but without the counterparty risk. The second layer is unsettled and less secure, but infinitely more usable. Bitcoin is incredible at censorship resistance and decentralization, but frankly terrible at speed and efficiency. Critics of bitcoin completely miss the fact that speed and efficiency should take place on higher layers, NOT on the base layer. Lightning’s arrival will show the world bitcoin’s true capabilities. If gold could only be used as a physical metal, global economic activity would have been prohibitive on a gold standard. Thankfully, paper gold satisfied the liquidity and capital market layer. Lightning Network ensures bitcoin’s path to global reserve currency because it makes bitcoin come alive. Once bitcoin can be transacted around the world without the constraint of a slow confirmation process, it can graduate from reserve asset to reserve currency. Lightning Network finally frees bitcoin from its base layer shackles.
Further Reading
This article is a prelude to my previous work. I have decided to make this article Part 1 of 4 in my series “The Lightning Network Reference Rate.” Please also check out the second and third parts of this four part series. In Part 2, “The Time Value of Bitcoin,” I introduce the concept of LNRR, or the Lightning Network Reference Rate. In Part 3, “The Bitcoin Risk Spectrum,” I discuss the reasons why LNRR can be a monumental innovation for bitcoin denominated capital markets. Part 4, coming soon, will be titled “The Lightning Network Reference Rate.”
Media Coverage of Bitcoin Is Still a Total Disaster
A recent Washington Post article shows how journalists get cryptocurrency wrong
Nic Carter
August 11, 2018
I ‘m fed up with journalists who are either ignorant or unwilling to learn about cryptocurrency holding forth on its perceived weaknesses. Recently, the Washington Post published a piece entitled “Bitcoin is still a disaster” by economic affairs reporter Matt O’Brien, which I feel relies on mistaken assumptions to paint a misleading picture of the world. Today, I’d like to engage with some of the claims made in the piece, and show how O’Brien — among many others — get it wrong.
Claim: Currencies are meant to be stable
“There’s one thing a currency is supposed to do that bitcoin never has. That’s maintain a stable value.”
This assumes that bitcoin is a currency, and that the definition of currency is normative (“x should do y”) as opposed to descriptive (“things of type x have the qualities y and z”). I’d classify Bitcoin the protocol as a complete monetary system, and bitcoin the unit of value as a commodity money, which has the potential to become a gold-like reserve currency. Commodities fluctuate — that’s what they do.
Additionally, currency isn’t meant to maintain a stable value. Monetary policy is used for a variety of macroeconomic objectives, including targeting GDP growth, unemployment rates, inflation, trade balances, and more. If stability was the objective, the Federal Reserve Board would target zero percent inflation rather than the two percent that it currently does. Am I moving the goalposts? It’s matter of figuring out how bitcoin is used, and what it was intended for. I’m not sure [bitcoin creator] Satoshi Nakamoto ever defined bitcoin as a currency. He defines it as a system for electronic transactions, a peer-to-peer version of electronic cash, and an electronic payment system. He envisions bitcoin as a protocol and a bearer digital unit of value.
The interpretation of bitcoin as a currency is mostly inferred by outsiders imposing a particular view upon the protocol. Unburdened by priors, a neutral analyst would probably describe it as something similar to gold. In fact, Satoshi described PoW (proof-of-work) with a reference to gold mining, and later discussed bitcoin as analogous to a scarce, inert, infinitely portable metal which might develop a monetary premium. He clearly saw it as a gold-like commodity which would recapture those same properties in the digital realm, and I think this the most fitting interpretation of the system.
Claim: Bitcoin was designed with volatility in mind
“Why has bitcoin’s price been so up-and-down? Well, part of it is that it was designed that way.”
This is an odd rewrite of history, or more charitably, a very strange interpretation of bitcoin’s purpose. The impossible trinity tells that it’s impossible to have free capital flow, sovereign monetary policy, and a fixed exchange rate all at the same time. Bitcoin was designed with sovereign monetary policy and a free flow of capital. No one underwrites or backs bitcoin, so it cannot be pegged to a real-world basket of goods. That’s the same with gold. Both have emergent monetary premia. This can’t be planned for — it just so happened that way. Needless to say, Satoshi didn’t design bitcoin to be unstable, he wanted to solve the problem of double spends with digital cash such that it didn’t rely on a single validator. Its volatility is an emergent property, not a design objective.
Claim: Validating transactions is the source of its computational overhead
“[…] the problem [with a decentralized network] was that the only way to do that would be for every member of that network to keep a record of every bitcoin transaction there had ever been — that way they knew who had bitcoin to spend — which would require_a lot _of computing power.”
This is a common misconception. PoW and mining ensures that the network deterministically converges to a shared history, without any subjectivity or off-chain coordination. The fact that the minted units have value means that miners are incentivized to behave appropriately in the short and medium term. And the fact that those units are worth $x means that miners will pay anything up to $x to obtain them. This is the source of the large quantities of computing power allocated to the network — the combination of efficient mining hardware and large amounts of value at stake.
The validation and record-keeping is behavior conducted by full nodes, not miners. The cost of maintaining the bitcoin data store is an externality pushed onto full nodes through bandwidth and storage costs. This is NOT the job of miners. This is a basic distinction lost on many.
Claim: Bitcoin’s volatility is unnatural
“But even this inbuilt volatility doesn’t fully explain why bitcoin has been on such a roller-coaster ride. Something else must be going on, and that something is plain-old manipulation.”
Volatility isn’t inbuilt, it’s a feature of every non-pegged economic asset. The Post should keep its fragilista-thinking to itself.
Does the Post have any proof that markets are not long-term efficient? If so, they have a Nobel prize in economics to collect.
Plain old manipulation? You really mean to tell me you think a $100 billion network was manipulated into existence? Is it so difficult to accept that bitcoin provides a differentiated, useful service to millions of people worldwide, and that’s why it has value? Does the Post have any proof that markets are not long-term efficient? If so, they have a Nobel prize in economics to collect.
“[…] what seems to still be happening in 2018 with various pump-and-dump schemes.”
Don’t conflate bitcoin with random worthless altcoins. There is a lot of PND [pump-and-dump] in this industry, but it is infeasible in the extreme to PND bitcoin. If you’re part of a PND group, you target alts in the $50–$300 million range, not bitcoin.
Claim: Bitcoin is only used as a currency due to the wealth effect
“The first is that what makes bitcoin work as a way to transfer things — the expectation that its price will keep rising.”
That’s not what makes it work. It works as a way to transfer things because it’s a pretty good distributed clearinghouse for value. If bitcoin were stagnant at $1000 for the next ten years, it would remain a good way to transfer things.
During the 18-month bear market that began in January 2014, people still used bitcoin. In fact, usage grew consistently the entire time.
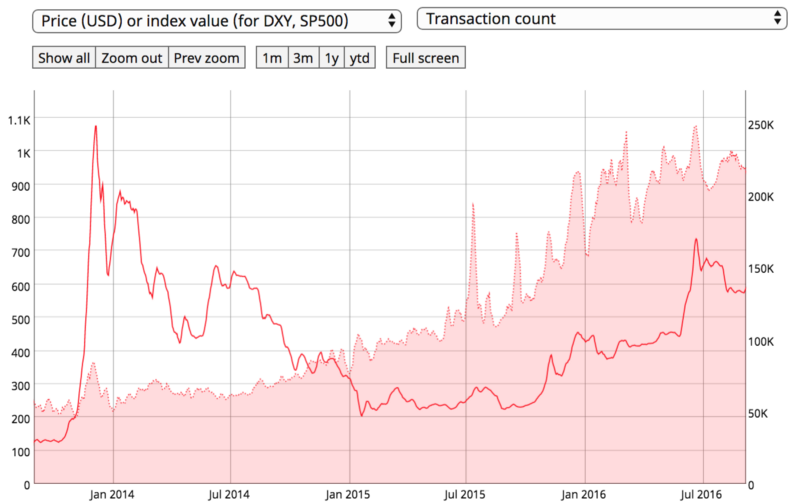 Price (solid red line) and transaction count (shaded red area) during the 2014–16 bear market. Image: Coin Metrics
Bitcoin offers transactors a rival benefit; something they cannot find anywhere else. It’s unique among cryptocurrencies, as it boasts the best reliability, uptime, dedicated track record, and protocol developer community. It’s unique among monetary assets because it offers properties not instantiated by gold or the USD. There’s a reason people choose bitcoin.
Claim: Bitcoin’s deflationary characteristics mean that no one uses it
“Why spend $100 worth of bitcoin today if you think it’s going to be worth $1,000 in a not-too-distant tomorrow? You wouldn’t. And people aren’t.”
Shameless plug: I urge you to consult my website Coin Metrics, where we make this data free and available so anyone can use it. Conservatively, bitcoin saw $2.5 billion in on-chain transaction volume yesterday. That’s omitting all the off-chain transactions that occur on Opendimes, on second-layer networks like Lightning, and internally at Xapo and at Coinbase.
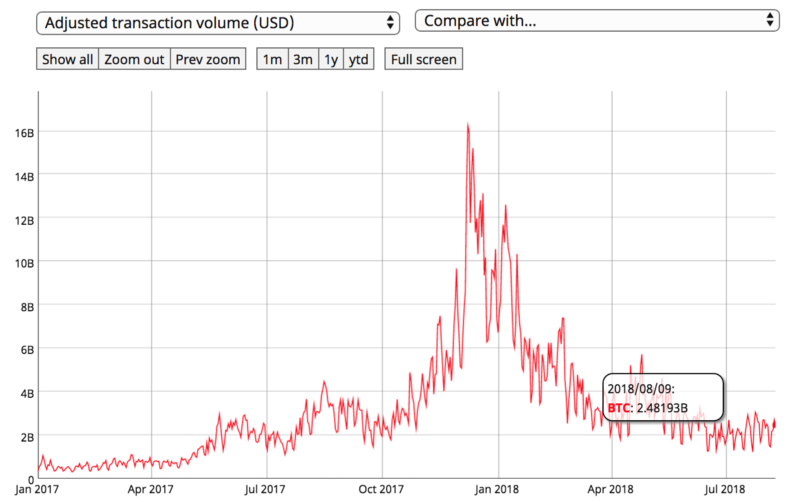 Image: Coin Metrics
In the last year, bitcoin routinely hosted the transfer of $2B worth of bitcoin a day, up to a peak of about $16B of bitcoin a day. That’s a lot of fake transactions. The anticipated response to this from the skeptic is that on-chain volumes are just a clearinghouse for the multitude of exchanges worldwide, or simply a way for individuals to access the altcoin casino. The former is probably true; we have good evidence that bitcoin is mostly an industrial network dominated by exchanges and power users rather than one that caters to end-users. Using the rough heuristic that industrial users tend to batch transactions, we can see that 30–40 percent of the network is industrialized in this manner.
There’s nothing wrong with this. It simply means that bitcoin acts as a decentralized global settlement network for a number of endpoints that connect it to everyday economic systems, with which users transact at the individual level. This is pretty radical! A decentralized, neutral, untamperable central bank that settles flows on a continuous basis between a global network of smaller banks (exchanges, merchants, and custodians). What a concept.
As for the “bitcoin as an on-ramp to the altcoin casino view,” if this were true, then bitcoin would have cratered along with altcoins as they fell 80–90 percent over the last six months. However, bitcoin has shown great strength against altcoins during the bear market. If you look at any index, bitcoin has regained dominance. This pokes holes in the story that it is only used for access to altcoin pump and dumps.
For context, here’s the Bletchley total market index quoted in bitcoins since December. Ever since the contraction began in January, bitcoin has strengthened against the rest of the cryptoasset market.
 Image: Bletchley Indexes
You wouldn’t expect this if bitcoin was only a vehicle for speculation on other cryptocurrencies. Clearly, there is demand for bitcoin in its own right.
Claim: Bitcoin is illiquid and hence manipulated
“This lack of liquidity makes it pretty easy for a few fraudsters to push the price up quite a bit.”
This isn’t the case, and relies on a flawed reading of the Tether situation. Fundamentally, bitcoin is quite liquid. It has huge volumes on listed exchanges, and probably the same amount again on over-the-counter providers like Cumberland, Circle, Genesis, and Octagon.
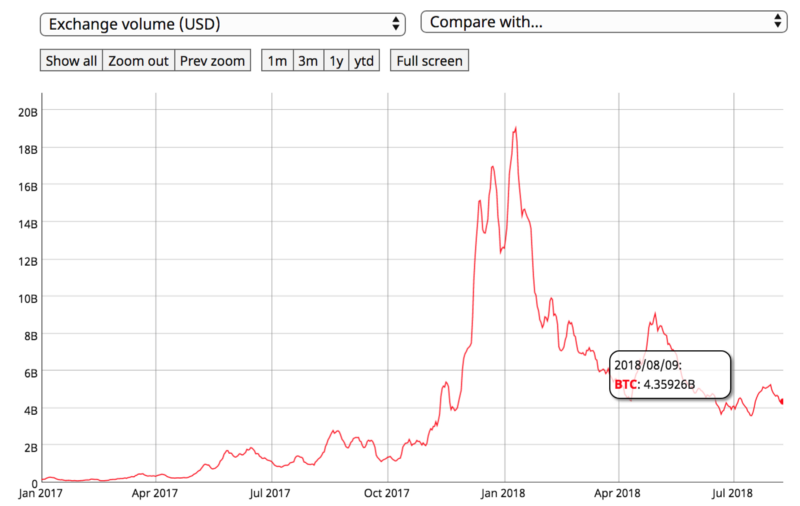 Much illiquid. Very manipulation. Image: Coin Metrics
Even if you subtract all Tether volume, and all volume from synthetic exchanges like BitMEX, and all swaps and futures volume from the CME and CBOE, you have robust volumes. The market for BTC → fiat (on the right in the chart below) is also quite liquid.
 Image: Nomics
If you look at the market for fully-regulated futures exchanges, the picture is sunny.
 CME daily volumes (contracts are for 5 BTC). Image: CME Group
Yesterday, 7077 contracts were traded at the CME — equivalent to $215 million. The liquidity picture is strong, and improving.
Claim: Bearer assets are dangerous and illegal
“There’s a reason, after all, why bitcoin has attracted so many scammers: All its transactions are irreversible.”
You have to take the bad with the good. It’s a digital bearer asset, which is completely new. Of course people want to scam with it — it’s the best money ever invented. That USD is never used by scammers, right?
“All of which is to say that if you steal a bitcoin, you get to keep a bitcoin.”
If you earn a bitcoin, you get to keep a bitcoin. If you mine a bitcoin, you get to keep a bitcoin. Strong property rights are a hell of a thing. This is just an incentive to build more secure wallet and custody software. We’re halfway there already.
Claim: Bitcoin still relies on a trusted set of intermediaries
“Bitcoiners think all of this is worth it. That it’s better to have a financial system that is clunkier, costlier and more vulnerable to attacks than it is to have to trust someone — or, more accurately, to_admit _that you have to trust someone.”
Using bitcoin doesn’t rely on trust in an individual. If you run a node, use a hardware wallet or a well-concealed paper wallet, and maintain good opsec, you are pretty much set. Of course, to obtain your bitcoin, you may have to use Gemini/GDAX/Square. But no one is forcing you to hold your bitcoin on an exchange. It’s only long-term storage on an exchange which requires significant trust in the institution. And bitcoiners universally, vociferously, encourage people not to do that.
Nothing backs bitcoin or pegs it to a basket of assets. That’s the point. Bitcoin was designed specifically to avoid the influence of a single authority.
More broadly, bitcoin doesn’t remove trust entirely. That’s a straw man frequently knocked down by critics. Bitcoin reduces the need for trust in a single institution. Instead, you just have to trust that the code is well-vetted in the typical FOSS [free and open-source software] manner, that the economics that underscore mining continue to hold, and that discrete log problem is still hard. We have plenty of evidence that these things all hold, and will continue to hold. And we have plenty of evidence that, conversely, a single institution in control of the money supply will always abuse its power. If you don’t believe me, just check out what’s happening in Turkey today. Seignorage is a drug — and it’s pretty much impossible to kick the habit.
“Bitcoin exchanges require some measure of [trust] whether they realize it or not.”
Centralized exchanges do. There exist non-custodial peer-to-peer exchanges, like Hodl Hodl and Bisq, for bitcoin. LocalBitcoins is another peer-to-peer exchange that places reduced reliance on a single intermediary. Even centralized exchanges can conduct periodic proofs of solvency, if users demand it. And, as with the rest of finance, if the brokerages/exchanges/clearinghouses are regulated under functional regimes, they are strongly incentivized not to run fractional reserves or lose user funds.
The broader point here is that relying on centralized exchanges is inevitable. Many people will trade off decentralization for convenience, and we can’t stop that. We can demand that exchanges behave appropriately. There are many exchanges and custodians with long histories of robustness, resilience, and integrity. There is a market for exchanges, and the badly-run ones will fail.
To sum up
The problem with this article is that the pundit in question has settled on a narrative — bitcoin is a poor economic system — and then searched for various datapoints that confirm his view. Bitcoin is volatile, yes. It is an emerging commodity-money that’s becoming financialized and growing from a small tribe of enthusiasts to a global user base. Of course it’s volatile. Growth is not linear. Only fragilistas demand it to be so.
Nothing backs bitcoin or pegs it to a basket of assets. That’s the point. Bitcoin was designed specifically to avoid the influence of a single authority. Bitcoin is priced exactly where it ought to be — this is always true. Manipulation might work on a 15-minute time frame, but it’s just implausible in the extreme that a $100 billion-plus asset class has been manipulated into existence.
Yes, bitcoin relies on exchanges to provide exit ramps for individuals that want to reduce their reliance on sovereign currencies. Sometimes those exchanges get hacked and fail. That is entirely natural. Bitcoin continues to chug along unaffected. It’s extremely popular; its strong assurances and settlement guarantees grant it daily volumes in the billions. It is a single order of magnitude behind Visa’s economic throughput — that’s right, just one 10x away. The gap will probably be closed in the next year. It has an unmatched record of reliability, resilience, and resistance to cooption. For a nine-year-old, this is a pretty good track record. If it were a human, it would be midway through the fourth grade.
Pundits will continue to ignore this; not because they’re incapable of reading the data, but because they don’t want to. They are deeply afraid of the world that bitcoin threatens to bring about. They prefer a paternalistic, easy-money regime, where occupations like punditry are profitable. Bitcoin promises accountability and a hard money standard. It threatens the existence of bailouts, moral hazard, and fiat-inflationism. In Bitcoinland, the only way to acquire wealth is to work for it. Cronyism doesn’t work, as the central bank of bitcoin is entirely indifferent to politics and lobbying. This offends the sensibilities of the partisans writing for the Post.
Bottom line, the central premise of the article is wrong:
“There’s one thing a currency is supposed to do that bitcoin never has. That’s maintain a stable value.”
Bitcoin isn’t designed to have a stable value. That just quite frankly isn’t what Satoshi set out to build, and that’s not the system we have today. Artificial stability — shorting volatility — leaves you destined for a blowup. That is the fate of any non-fully-backed stablecoin. Bitcoin is designed to solve the double spend problem for digital cash, and to provide a predictable monetary policy. It does that very well, it has done that for the last nine and a half years, and it will continue doing that for the foreseeable future. Demanding low volatility on top of that is farcical, and betrays deep ignorance about the tradeoffs inherent in monetary systems, and the way that financial markets work more generally.
Bitcoin is still an emerging, youthful asset. It hasn’t reached maturity. It has somewhere in the realm of 50–100 million holders/users; that’s global penetration of a percentage point or two. The base layer still hasn’t been nailed down, let alone the next layers up on the stack. Development is deliberate and careful, because this is money we’re talking about, not a consumer app. Governance is hard to organize; consensus is difficult to obtain. The internet wasn’t built in a day, and neither will the protocols for transmitting value trustlessly.
Since the market is constantly revising its expectations for bitcoin, amid a backdrop of growing, unsteady adoption, its exchange rate is volatile. No one is forcing you to hold it; it is totally opt-in. Bitcoin may not make sense for Westerners who live under somewhat credible monetary regimes, but it might be a good bet for an Iranian, a Venezuelan, a Turk, or anyone else who mistrusts their monetary authorities. Truthfully, mechanisms to bring bitcoin to these disempowered groups are still lacking or nonexistent. But they have the right to money that isn’t controlled and minted by a hostile state. This is why bitcoiners work to make global access to this economic institution a reality.
Bitcoin’s complexity doesn’t acquit these pundits for getting simple facts about bitcoin blatantly wrong. And ultimately, their ignorance hurts their bottom line. Being amateurishly wrong about basic details of a system that is widely-understood undermines their integrity and makes readers question their work. The Post’s owner Jeff Bezos should understand this and demand more from his employees.
I f any of this resonates with you, and you want to learn about this novel economic system, here are some sources I recommend for a better understanding of bitcoin:
- Coin Metrics: no-nonsense open data and charting platform informing users about the actual usage of cryptocurrencies (full disclosure: I am a Coin Metrics cofounder)
- Bitcoin Visuals: charts and visuals relating to bitcoin and the Lightning network
- Jameson Lopp’s list of Bitcoin resources
- “Bitcoin’s Academic Pedigree,” Arvind Narayanan and Jeremy Clark
- BitMEX research: long-form investigations into bitcoin economics, the Tether mystery, and market dynamics
Thank you to hasufly and Larry Sukernik for their feedback.
Bitcoin, Stock & Flow
By Hugo Nguyen
Posted August 15, 2018
Bitcoin is protected by a combination of stock & flow.
What is stock? And what is flow?
In general terms, flow is defined as a quantity which is measured over a period of time. Flow is the rate of change. Examples include business earnings, cash flows, national GDP, rate of depreciation, mortgage payments, number of births/deaths per year, rate of carbon dioxide extraction by plants, etc.
Stock, on the other hand, is defined as an accumulation of flows over time, and is measured at one particular moment in time. Mathematically, stock is an integral function. Stock can also be depleted with outflows (negative flows). Examples include business capital, inventory, house equity, total oil reserve, total carbon dioxide concentration in the atmosphere, etc.
In accounting terms, stock is typically represented in the balance sheet, and flow is represented in the income statement.
What does all this have to do with Bitcoin?
It turns out that Bitcoin economics is also governed by stock & flow variables.
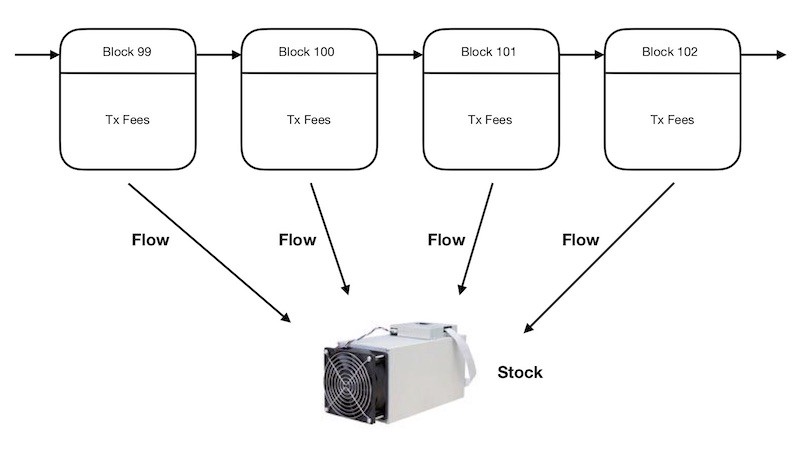 Bitcoin: stock vs. flow
Flow in Bitcoin is the total amount of reward per block — with a new block getting mined roughly every 10 minutes. During the bootstrapping phase of Bitcoin, flow consists of a nominal amount of transaction fees and a block subsidy.
When Bitcoin eventually takes off its “training wheels” (block subsidy goes away completely), flow will then consist purely of transaction fees.
Stock in Bitcoin is the specialized mining equipment, which has evolved into ASICs [1][2]. It is important to realize that mining equipment is also a manifestation of fees. They represent the potential stream of fees earned in the future, discounted back to the present. This is what we mean by “integration of flows”.
Bitcoin, in essence, is protected by (i) the fees today and (ii) a stream of fees in the future (manifested in the mining equipment). A combination of stock & flow.
Understanding this basic fact helps us develop better models for understanding Bitcoin security. E.g., things such as the true cost of a majority attack.
[1]: Mining equipment is a stock as long as Proof-of-Work mining requires highly specialized & non-repurposable equipment. In some PoW cryptocurrencies, the equipment is repurposable, which makes the currencies vulnerable to rental attacks. Renting changes mining equipment from stock to flow, and potentially reduces the cost of attack for the attacker.
[2]: Mining stock provides security to the extent that it is sufficiently decentralized. A high level of mining centralization exposes Bitcoin to threats such as government takeovers, and is a legitimate concern.
The Store of Value Thesis
By Qiao Wang and Dan McArdle
Posted August 19, 2018
Introduction
One way of thinking about cryptoasset valuation says that only assets that can become a store of value (SoV) are deserving of high network value. This is a mental model that has been around for a while, and one that we largely hold when making investment decisions. So let’s unpack it.
You might think that high usage leads to high network value, i.e., if millions of people use a coin as cross-border payment or as gas for dapps, it must be valuable, right?
Generally, this can only be true if users want to hold the coin for a while, in addition to actually using it. If you want to use a coin that you don’t already own, but everyone who has the coin today just wants to hang on to it, you have to offer people a high enough price for it that they’ll let go. Conversely, if users are willing to get rid of the coin right after they’re done using it, there’s almost always more than enough to go around and no one has to bid up the price in order to use the network.
So whether or not a cryptoasset will become a SoV boils down to the following question: why would people want to hold an asset for a long time versus a short time?
First-order properties
We believe that a cryptoasset must satisfy three properties in order to become a SoV that people are willing to hang on to.
- Immunity to theft
- Credibly low inflation
- Low cost of conversion
1) Immunity to theft
For a network to have this property, it needs to be immune from malicious actors who may wish to steal from accounts/balances. For instance, they could exploit buggy smart contracts you interact with, reverse a transaction that was sent to you, prevent you from making transactions, or obtain your private key.
2) Credibly low inflation
Not wanting to be inflated away is obvious, but the word “credibly” here is key. Many monies or cryptoassets may claim to have low or no inflation, but they aren’t necessarily structured so that that’s believable. Is the network technically secure against an attacker who might try to change its rules by force? Outside of attack scenarios, who sets the monetary policy and are they incentivized to modify it?
3) Low cost of conversion
Axiomatically, a SoV is something which we don’t need now but can expect to be able to convert to another product or service that we need at some point in the future. As such, it’s not a good SoV if conversion is expected to be expensive.
If you think about it, a SoV really is just a combination of three things. 1) You can store it securely. 2) It cannot be reproduced easily. 3) You can trade it or use it cheaply.
Second-order properties
Those are three first order properties of a good SoV. But we can further deduce second-order properties that lead to these first-order properties. In order words, what are the means to these ends?
1) Immunity to theft requires
- Small software attack surface. For instance, Ethereum has larger attack surface than Bitcoin does, as it can perform more complex smart contracts. As such, Ethereum holders have endured hacks like those of the DAO and Parity.
- High cost of 51% attack. The attacker could reverse a transaction that was sent to you. Here’s a comparison of cost of attack between DCR and BTC.
- Decentralization. Similarly to the above, centralization increases the risk of transaction reversals .
- Privacy. Government or malicious individuals could physically force you to surrender your coins if they can easily identify your blockchain activity with your addresses.
2) Credibly low inflation requires
- Small software attack surface. Are there bugs that attackers can exploit to create a large number of coins?
- Decentralization. Are there one or a few powerful actors who can change the monetary policy?
- Collective commitment to low inflation. This is almost tautological, but different cryptonetworks do exhibit different levels of commitment. Early Bitcoin adopters’ uncompromising commitment to a fixed monetary supply attract like-minded people.
3) Low cost of conversion requires
- Utility. Higher utility means there are more opportunities to directly transact in the cryptoasset, and that more people need to trade their fiat for crypto in order to use it, leading to higher market liquidity.
- Decentralization.Greater decentralization makes it harder for anyone to censor transactions that involve a conversion of SoV for something else.
As a side note, interestingly, decentralization is required for all three. This is why the crypto community values decentralization so much. It is the only obvious means by which a network can make credible statements about its properties of immunity to theft, low inflation, and uncensorable transactions.
Deeper Look at “Low cost of conversion”
1) Immunity to theft and 2) credibly low inflation, as well as the second-order properties associated with them, appear to be commonly accepted by the community. But 3) low cost of conversion is the one that doesn’t seem to have gotten much attention. Let’s take a deeper look at it and its second-order properties: utility and decentralization.
Utility
As previously mentioned, an asset is not a good SoV if the cost of conversion is high. Furthermore, there are two ways to convert cryptos to something else: indirectly via fiat or directly.
Indirect conversion cost is determined by crypto-fiat liquidity. The latter, among other things, is a function of the current utility, as one must trade fiat for the crypto to in order to use it, and the level of speculation on future utility.
But ultimately, cryptonetworks should aim for as much direct conversion as possible (e.g., purchase with BTC, run dapps with ETH), because by definition it’s cheaper than indirect conversion. And direct conversion is, indeed, current utility.
This line of reasoning suggests that utility is important for both indirect conversion and direct conversion and, by extension, SoV. As an illustrative question, will gold depreciate over time as new technologies like fiat and crypto become more widely utilized as as media of exchange? Our hunch is yes.
Decentralization
But cost of conversion doesn’t have to be financial. It can also be opportunity cost or mental cost.
In both indirect conversion and direct conversion, censoring transactions and uncertain monetary policies leads to opportunity cost and mental cost. Decentralization improves censorship-resistance and monetary policy stability, thereby reducing cost of conversion.
At the extreme, if network validators can censor transactions from certain addresses indefinitely, i.e., the cost of conversion is infinite, then the owner has practically forfeited their assets.
Conclusion
We believe that value will ultimately accrue to SoV cryptoassets, and we provide a framework for thinking about SoV properties. In particular, we reason from the ground up by laying out three first-order properties, which in turn are induced by multiple second-order properties.
But the framework doesn’t stop here. One can build up from these second-order properties to discover even higher-order properties. Each of these merits a essay that is beyond of the scope of this one.
Take “decentralization” for instance. Higher-order properties that lead to greater decentralization include:
- Founder myth
- Gini coefficient
- Independent development teams
- Cost of operating a node
What about “utility”? Examples of higher-order properties that contribute to utility are:
- Programmability
- Development infrastructure
- Scalability
A second-order property could even be a third-order property associated with another second-order property. For instance, in the False Dichotomy of Utility and Store of Value, we argue that utility leads to greater decentralization and higher cost of majority attack.
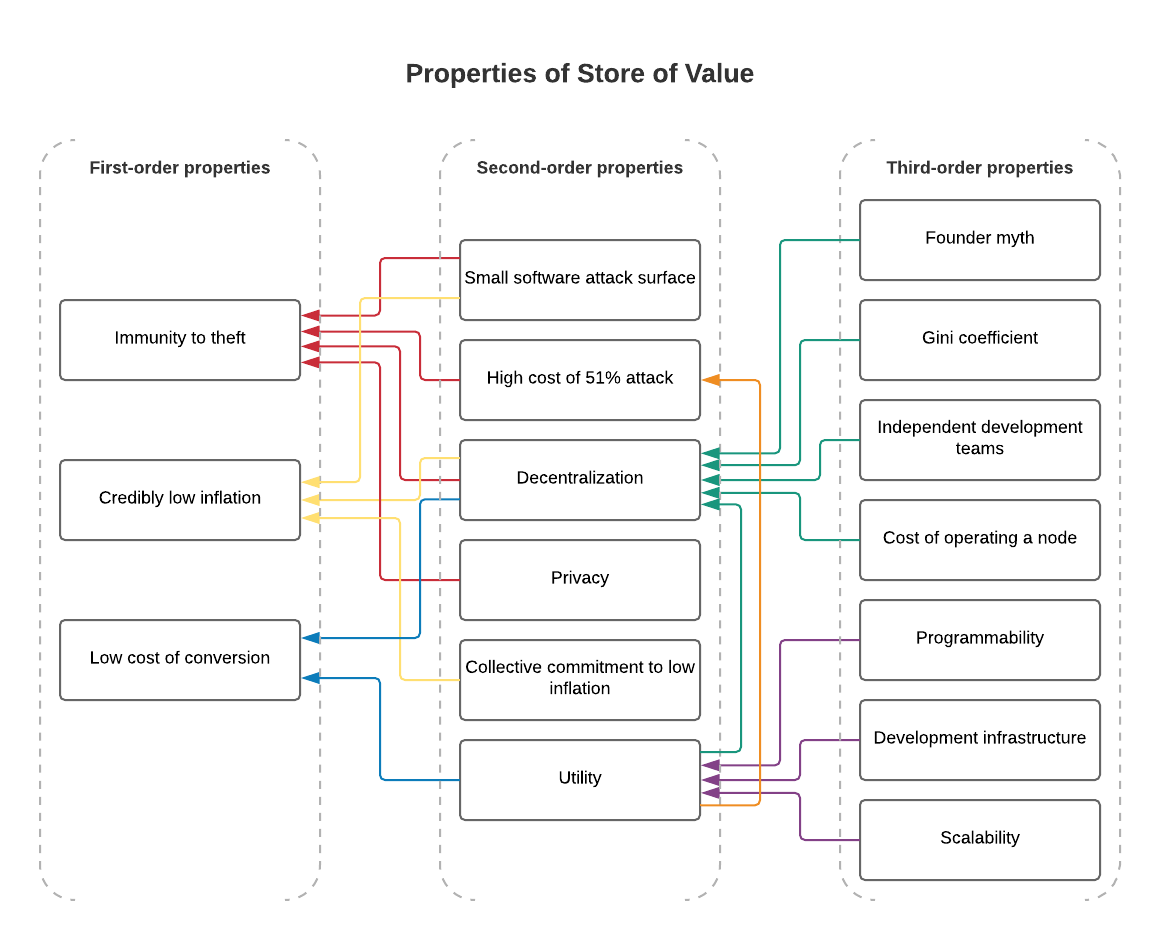
In short, valuing an early-stage cryptoassets boils down to the question of how likely it will acquire and maintain the first, second, and higher-order properties of SoV described in this post. By way of example, BTC is arguably the best at immunity to theft and credibly low inflation, but will it achieve more utility than say, ETH? EOS has a shot at surpassing ETH utility-wise, but will it ever be as decentralized?
Bitcoin, Chance and Randomness
By Hugo Nguyen
Posted August 25, 2018
 The same rule governs this pair of dice & Bitcoin PoW
Randomness forms the cornerstone of Bitcoin’s Proof-of-Work (PoW). But how did we get here?
A brief history of the study of randomness [1]
Randomness has always been an essential part of life. Many ancient divination rituals were based on chance: the tossing of astragali (animal knucklebones) by the Greeks, Kau Cim sticks by the Chinese, Opele chain by West Africans. The use of dice-like devices in games & gambling also goes back thousands of years.
 Kau Cim sticks
Yet, it was not until the 16th century that we started gaining the necessary tools and languages to really understand chance and randomness. Those tools include arithmetic concepts such as fractions and the number zero.
Our study of chance and randomness began in earnest with a man named Gerolamo Cardano [2]. Born in Italy in 1501, Cardano was a polymath and one of the most influential mathematicians of the Renaissance. He was also a notorious gambling addict. Due to his gambling problem, Cardano eventually sunk into abject poverty and obscurity. It was his experience with gambling, however, that led him to write the “Book on Games of Chance” — the first systematic treatment of chance and randomness. Interestingly, Cardano intended to keep the book secrets to himself. The “Book on Games of Chance” was published a century after it was written, long after Cardano’s death.
 Gerolamo Cardano (1501–1576)
Cardano’s main contribution to our understanding of chance and randomness was the idea of sample space. At the most basic level, calculating the probability of an event involves the simple task of counting the number of scenarios that could lead to said event, then divide that by the total number of all possible scenarios (the “sample space”), assuming all scenarios are equally likely. This assumption only holds true for problems like dice rolling, but it was a good start.
Following in Cardano’s footsteps was Galileo and Pascal. Galileo was the perfect embodiment of the rebellious intellectual spirit of that era: going against the powerful Catholic Church and proclaim that the Earth is not the center of the universe. Galileo produced many important work. One not very well-known work, “Thoughts about Dice Games”, explored similar topics that interested Cardano.
Pascal, a contemporary of Fermat and Descartes, went a lot further than Cardano and Galileo did. He discovered what we now call the Pascal’s triangle. Although mathematicians in other civilizations (e.g.: Iran, China & India) had discovered the same triangle centuries before Pascal did, Pascal’s work was the most comprehensive and added novel applications, specifically in the area of probability theory. Pascal also introduced the “Pascal’s wager” and the concept of mathematical expectation.
From the seed that Cardano, Galileo and Pascal planted, our understanding of chance and randomness gradually grew, over time becoming more sophisticated and refined. This was a common theme of the Renaissance: a few fundamental breakthroughs — such as astronomy, Newtonian physics, calculus, empiricism — laid the scientific foundation that brought forth new branches of knowledge and major technological innovations, which eventually led to the Industrial Revolution.
List of notable milestones in our journey of cracking chance and randomness:
- Sample Space
- Permutations & Combinations
- Pascal’s Triangle
- Law of Large Numbers
- Law of Small Numbers
- Bayes Theorem — Conditional Probability
- The Bell Curve & Standard Deviations
- Regression Toward the Mean
- Random Walk
- Monte Carlo simulation
- Pseudorandomness
 Normal Distribution a.k.a. the “Bell Curve” — image by Dan Kernler/ CC 4.0
Two major developments stand out: Monte Carlo simulation and Pseudorandomness. Particularly because they’re highly relevant in today’s world.
The invention of the computer opened the door to a brand new application of randomness: computer simulation. For the first time in history, we have a way of “predicting” the future or uncovering hidden truths by cheaply performing experiments, over and over again. The large number of simulations afforded to us by the machines was previously unthinkable.
The invention of Monte Carlo simulation in the early 20th century marked a major turning point in human history. Prior to the Renaissance, humans often lived in fear of randomness, of uncertainty. Leading up to the 20th century, we slowly improved to gaining a better understanding of it, but still largely let randomness dictate the flow of things. With Monte Carlo simulation, we started making randomness work for us. The apprentice has become the master.
Notable early pioneers of Monte Carlo simulation included John von Neumann and Alan Turing, the two godfathers of the modern computer.
Nowadays, Monte Carlo simulation has a large number of applications: fluid mechanics, business, finance, artificial intelligence, to name a few. The recent case of AlphaGo is the perfect example of how Monte Carlo simulation (combined with other techniques) can guide us to new discoveries: AlphaGo outplayed the best human players with moves that completely surpassed our imagination and the rich literature of Go. AlphaGo challenges the idea that machines cannot be creative, and forces us to rethink what “creativity” really means.
The rising popularity of Monte Carlo methods was what spurred the development of “pseudorandomness” (a pseudorandom process is a process that appears to be random, but it’s not), because a good simulation needs to be able to closely mirror the random nature of reality. Numbers generated by such a process are deterministic, but they pass statistical tests of what is considered “random”. Pseudorandomness, in turn, became one of the building blocks of a brand new field — also a child of the computer age: modern cryptography.
Which brings us to Bitcoin.
The role of randomness in Bitcoin
One of the major innovations in Bitcoin is the use of Proof-of-Work in establishing distributed consensus. PoW provides an objective yardstick which Bitcoin network participants can rely on to come to consensus, without trusting anyone on the network. This is unlike schemes like Proof-of-Stake which relies on a subjective interpretation of consensus. This section assumes PoW is the only secure way to implement a blockchain. (For a refresher on PoW, read part 1: the Anatomy of Proof-of-Work.)
The “work” in Proof-of-Work involves searching for a hash output that has a minimum number of leading zeros. (There are some constraints on the hash input, such as formatting, timestamp, etc.)
Bitcoin PoW scheme uses a cryptographic hash function called SHA256. An important feature of cryptographic hash functions is that they are one-way. Meaning that it is infeasible to deduce the hash input just by looking at the hash output. And the reason they are one-way is largely due to how random the hash output is.
This turns out to be extremely critical because if the hash function doesn’t generate sufficiently random (“pseudorandom”) output, one can start with the desired output, i.e.: a string with a certain number of leading zeros, and work backward from there. This would render the proof less trustworthy at best, and useless at worst.
In simple terms, what a typical PoW scheme does is (a) it poses a problem whose solution lives in an incredibly large space, (b) there is no shortcut and (c) the only way to arrive at the solution is by brute-forcing and randomly searching the large space. Much like searching for a needle in a gigantic haystack. (The official computer science term for this is “unbounded probabilistic iterative procedure” — quite a mouthful.)
So the randomness of the hash function determines how strong the proof is.
Hashing (provides) → Randomness (backs) → Proof-of-Work
“…a good puzzle gives every miner the chance of winning the next puzzle solution in proportion to the amount of hash power they contribute. Imagine throwing a dart at a board randomly, with different sized targets corresponding to the mining power held by different miners.”— Arvind Narayanan [3]
There is no formal proof that randomness is a mandatory requirement for PoW, but empirically, this seems to be true. There’s also the simple observation that any problem whose solution is non-random, tends to require as much effort to verify as to compute the solution in the first place. Any such scheme would be seriously constrained in terms of scalability (keep in mind, Bitcoin is incredibly hard to scale as-is). It would also disproportionately favor the fastest miner — to the point where slightly slower miners earn nothing.
Another benefit of randomness-based PoW is that mining membership is highly open: miners can come and go whenever they like. It doesn’t matter if they join immediately after a block has been found, or 5 minutes after, their chance of earning the next reward doesn’t change.
What about hashing? Is it the only way to get randomness? Probably not. There are other known ways to simulate the process of random search besides hashing, such as integer factorization or discrete logarithm.
So it’s highly likely that hashing is not the only means to achieve randomness, while randomness is a necessary precondition for creating digital Proof-of-Work.
PoW schemes fall into two major categories:
- Compute-bound: where the random search is bound by processor speed
- Memory-bound: where the random search is bound by memory accesses
It remains to be seen whether one PoW category is materially better than the other (I personally think memory-bound is worse [4]), but the underlying mechanism is the same: a probabilistic, random search in a huge solution space, and any solution can be verified cheaply.
In summary, for as long as humans have existed, we have struggled with randomness and uncertainty. The invention of the modern computer and Monte Carlo simulation in the 20th century allowed us, for the first time, to turn randomness to our advantage. The use of randomness in Bitcoin marked another milestone in this long journey. Randomness, in short, is what backs the “proof” in Proof-of-Work. Without randomness or really good pseudorandomness, Proof-of-Work would not work.
If Bitcoin succeeds in being money of the future, it would represent our most significant and largest-scale application of randomness thus far.
*This is part 2 of the Bitcoin Fundamentals series. Check out the full series here: part 1 , part 2 , part 3 , part 4 , and part 5 .
Acknowledgments
Thanks Steve Lee & Nic Carter for the valuable feedback.
[1]: For a detailed history of randomness, check out The Drunkard’s Walk: How Randomness Rules Our Lives , by Leonard Mlodinow.
[2]: Not to be confused with the cryptocurrency Cardano, which ironically is based on Proof-of-Stake.
[3]: Arvind Narayanan, Bitcoin and Cryptocurrency Technologies: A Comprehensive Introduction .
[4]: A couple of potential issues with memory-bound PoW schemes:
- Memory-bound PoW still requires computations, but operates under the assumption that memory technology has already plateaued, which makes memory the primary bottleneck in mining operation. But if this assumption is broken, instead of facing centralization forces on one front (ASIC), you’d potentially face centralization forces on two fronts (ASIC and memory).
- The memory used in memory-bound PoW is likely to be repurposable beyond mining. This might have a negative impact on network security because that opens up the possibility of an attacker renting memory from others (since anything repurposable would likely have an abundance of supply and occasional supply surpluses), which reduces the cost of a majority attack. Hardware repurposability in general is not desirable for Bitcoin security.
Gravity
By LaurentMT
Posted August 27, 2018
This is post 1 of 3 in a series
“Law I: Every UTXO persists in its state, except insofar as it is compelled to change its state by force impressed.” — Isaac Newton, Principia 2.0
 Newton diffracting an UTXO with payment batching
In the last years, a lot has been written about the “huge waste of energy” resulting from Bitcoin’s Proof of Work (PoW). In this series of four posts, we’re going to challenge this widespread opinion by questioning the main metrics used to highlight the alleged increasing inefficiency of Bitcoin’s PoW.
In this first part, we’ll first discuss the main utility of PoW in the Bitcoin protocol. Then, after a reminder of two important properties of Bitcoin’s PoW, we’ll define a mathematical formalization of this utility (Bitcoin.Days Secured) and we’ll use it to define two new metrics (Unit Cost and Average Cost). At last, we’ll check what these metrics can teach us about the evolution of the efficiency of Bitcoin’s PoW over time.
Prologue: The Cryptopocalypse is coming
The news was on all the media a few months ago. The cryptopocalypse is coming. Bitcoin’s Proof of Work (PoW) is so bad that it’s going to destroy the world in 2020…
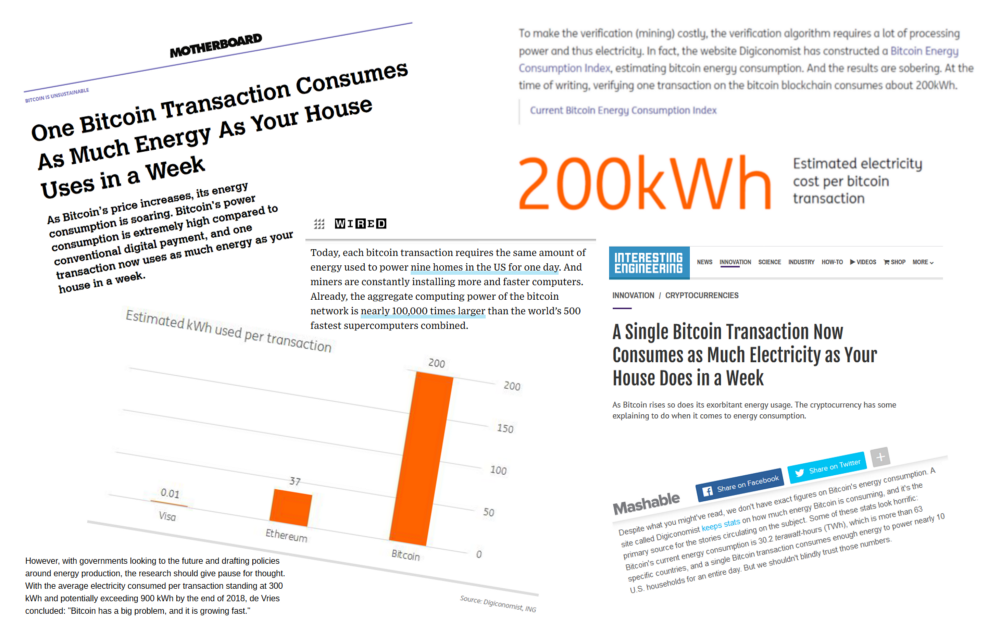 Pot pourri
Reading a bit further, you may have noticed that most of these articles were based on the results of an analysis provided by Alex De Vries, a “financial economist and blockchain specialist” working for PWC Netherlands and author of the site Digiconomist.
I must confess that I have mixed feelings about this study. My issue with De Vries’s work isn’t the estimated electricity consumption (this part has already received its “fair share” of criticisms) but the repeated use of a specific metrics: the electricity consumption per transaction. Don’t get me wrong. In terms of communication, this metrics is pure genius especially for those eager to make a point against Bitcoin’s PoW. The figure seems so outrageously disproportionate that it prevents any further discussion. The problem is that this metrics is fundamentally wrong. For several reasons.
First, it mistakes the number of transactions with the number of payments. But let’s be fair, that doesn’t radically change the actual figure. So let’s forget about that.
The second issue is that the figure is often published without specifying that there’s no correlation between the electricity consumed and the number of transactions; or to put it differently it’s almost never acknowledged that the electricity consumed is a fixed cost with regards to the number of transactions (and not a variable cost). With technical solutions like payment channels or the Lightning Network, it’s obvious that we can radically decrease the value of this metrics as low as we want. That highlights 2 points: the metrics is easily “abusable” and it doesn’t tell us anything about future performances of Bitcoin’s PoW.
The last problem with this metrics is that it promotes a flawed understanding of the utility of Bitcoin’s PoW. It’s no surprise that it has gained a lot of traction in a period of “Blockchain, not Bitcoin” frenzy but we should make our best to promote rational thinking instead of an endless squabbling based on emotional reactions.
So. Arrived at this point, we’re facing the obvious question…
What is the utility of Bitcoin’s PoW ?
The “Gold Mining” theory
A first theory is that the main utility of the PoW algorithm is the issuance of new coins. Paul Sztorc has written a good post on the subject. This theory is seducing because it seems consistent with the widespread metaphor of gold mining used for explaining the mechanism.
I have sympathy for this theory and I think that it captures an important aspect of the protocol but for this series of articles, I’m not going to consider the issuance of new coins as the main function of the PoW algorithm. To support this choice, I’ll refer to this observation: while it’s expected that the emission of new coins stops around 2140, it’s not planned that Bitcoin mining stops at the same date. That suggests that PoW plays another important role in Bitcoin.
The “Section IV” theory
A second theory is that the answer to our question was given 10 years ago by the creator of Bitcoin. In the fourth section of the White Paper to be more specific.
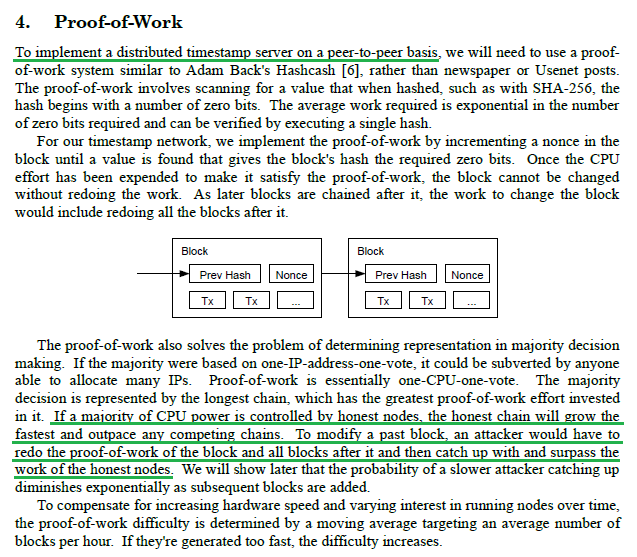 Section 4
I’m going to summarize this theory with the following sentence
The main utility of Bitcoin’s PoW is to secure an economic history.(1)
This is all well and good but in its current form this assertion isn’t very useful. A mathematical model would be far better. That raises a new question: how to express the “security of an economic history” as a mathematical equation ?
Digital Gravity
From the previous definition, we can state that our model should be able to express:
- economic values secured by the system (ideally, it should be able to do that atomically or in aggregate),
- the security provided to these economic values (or at least a good proxy metrics).
Since there’s no such thing as a “coin” in the Bitcoin protocol, our model will use the concept of Unspent Transaction Output (UTXO) as the elementary object of value.We can then easily define the total economic value secured by the system by adding the economic values of all the UTXOs existing at a given moment (UTXO set). Good. We already know how to express economic values in our model.
Now we need to express security. Obviously, PoW is going to play an important role here. Thus, it seems important to recall two of its properties
Proof of Work is Global and Cumulative
In a sense, PoW is similar to Gravity (to a homogeneous gravitational field to be more specific) which has a simultaneous influence over all bodies in its field, with a cumulative effect on their individual speed.
In the case of Bitcoin:
- when a new block is mined, the security provided by its PoW is simultaneously and equally applied to all the existing UTXOs,
- an UTXO “accumulates” the PoWs associated to all the blocks mined since its creation. All others things being equal, the more hashes accumulated, the more secure the UTXO.
These two properties are fundamental for studying the economics of Bitcoin’s PoW. Sadly, they’re totally missing in the metrics used by De Vries.
Let’s make a few assumptions
Before going further, let’s make a few assumptions:
- A1: For the last 9 years, Bitcoin has been the most secure public blockchain in terms of PoW.
- A2: At any given point in time, all existing and significant computing power usable for Bitcoin mining was used to mine Bitcoin.
- A3: The marginal cost and revenue of Bitcoin mining are equal.
- A4: Fees paid to miners are negligible when compared to block rewards and they can be ignored.
While these assumptions are likely to be more or less inaccurate in the real world, they seem good enough for this preliminary investigation.
Ok. Now, let’s try to translate this idea of the “security of an economic history” into a mathematical model.
Number of “Bitcoin.Hashes Secured” by an UTXO
Our first attempt will be straightforward. Basically, we’re going to multiply the value of the UTXO by the number of hashes it has “accumulated” between its creation and a given block.
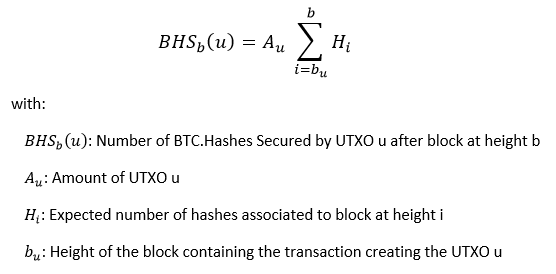
While simple, this definition captures the intuition that the system provides more utility when an UTXO has “accumulated” more hashes and/or when its value is higher.
That being said, this model isn’t really satisfying because the number of accumulated hashes isn’t a very good proxy for measuring the security of an UTXO. The main reason is that the quantity of computing power dedicated to Bitcoin mining has greatly increased over the years. Thus, the computation of a PoW securing an old block may have required 10 minutes in 2009 but it will be computed in a fraction of that duration when done with modern ASICs.
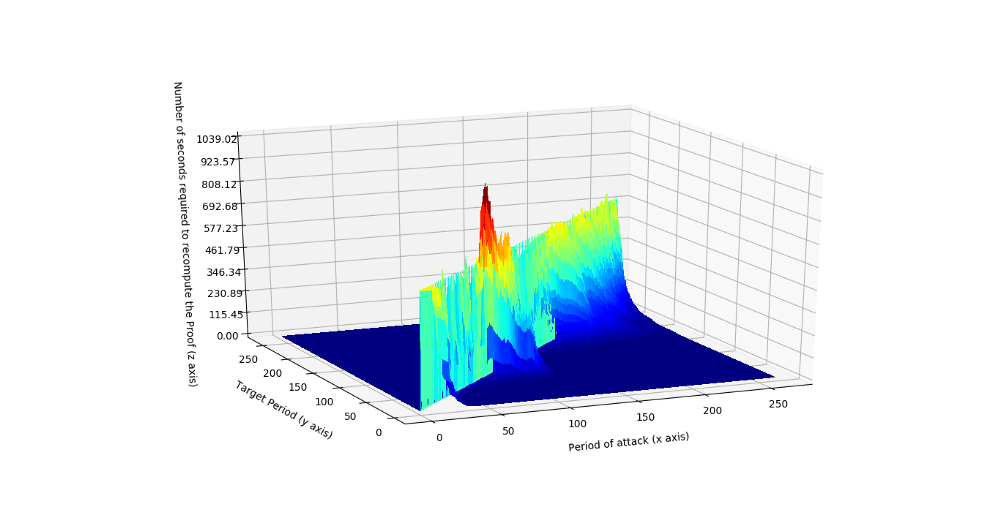
Satoshi’s Wall (number of seconds required to compute the PoW of a past block with 100% of the average computing power used during the period between 2 difficulty adjustments)
It seems clear that we need a better model taking into account this fact.
Number of “Bitcoin.Days Secured” by an UTXO
First, we’re going to add a new item to our list of assumptions
- A5: On large enough periods of time, the average amount of computing power dedicated to Bitcoin mining monotonically increases.
Once again, we can’t assert that this assumption is always true or will always be true. Anyway, it has been almost always true in the past, so let’s go with this hypothesis.
We can now define the security of an UTXO at a given block B as the number of days that would be required to rewrite the history since the creation of the UTXO, with 100% of the computing power used to mine block B.
For an individual UTXO that give us the following equation
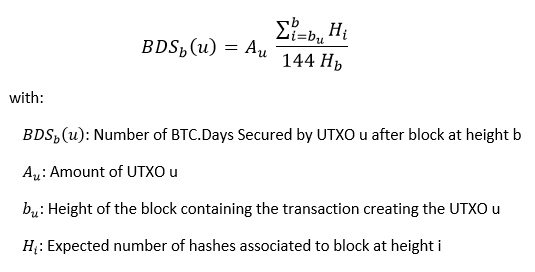
and the following equation for the UTXO set
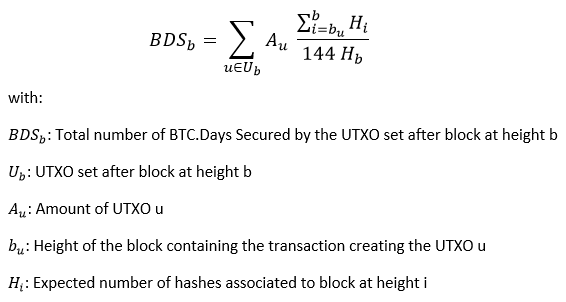
You may wonder why this choice of “100% of computing power used to mine block B”. It’s simple. Under our current assumptions, we can consider this definition as a kind of worst case scenario (“How long would this UTXO remain secure if all the available computing power was used to rewrite the history ?”). Moreover, while an alternative scenario (50%, 200%, N%) would change the absolute values of our results, it wouldn’t change the overall evolution of the metrics over time.
Bitcoin’s PoW efficiency
All Right. Now that we have a model for the utility provided by Bitcoin’s PoW, let’s check what we can learn about its efficiency. For this, we’re going to define two metrics.
Unit Cost of a Bitcoin.Day Secured added by a given block
For this first metrics, we’re going to divide the reward associated to the block (c.f. assumption A3 about the margin costs and revenues of mining) by the number of bitcoins.days secured added to the existing UTXOs by the block.
It gives us the following equation
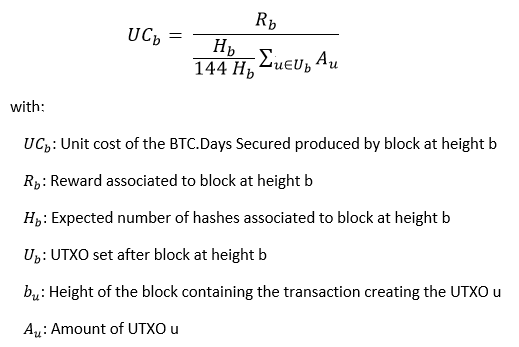
By definition, the sum of the values of all the existing UTXOs is the number of existing bitcoins and is equal to the sum of all past block rewards:
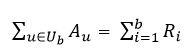
Thus our equation can be rewritten as
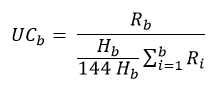
and finally simplified as
There are a few observations to be made here.
First, the Unit Cost is expressed by default in bitcoins/bitcoin.day secured but we would obtain the same result if we expressed it in USD/USD.day secured (both the numerator and denominator of our equation express the value of bitcoins at the same instant).
More importantly, it’s worth noting that the Unit Cost doesn’t depend on external factors like the market price or the number of hashes computed.
The Unit Cost only depends on the rules defining the controlled supply of the currency. It is defined by design.
Let’s check the chart associated to this metrics
I guess that many people will be surprised by this chart but we can clearly observe that the Unit Cost is monotonically decreasing over time. This result can be explained by the joint influence of the deflationary model of Bitcoin(halving of rewards) and the temporary inflation caused by the creation of new coins. The situation should change when all bitcoins have been created. At this point, external factors will play a role on the evolution of the Unit Cost but it’s hard (if not impossible) to predict how things will evolve. Let’s note that the situation may also change before this date if/when fees become an important part of the mining incentive .
Average Cost of the Bitcoins.Days Secured added up to a given block
For this second metrics, we’re going to add all the costs expended on mining from the first block to the block of interest. Then, we’re going to divide this total cost by the sum of all the bitcoins.days secured created by these blocks.
Note that we’ll express all costs and UTXO amounts in USD because we need to deal with the value of UTXOs at different periods of time.
That gives us the following equation
which can be rewritten as
and finally simplified as
That gives us this chart
As it was the case with the Unit Cost, the Average Cost suggests that Bitcoin’s PoW is indeed becoming more efficient over time. This result might seem counter intuitive because of the apparent increasing absolute cost of Bitcoin’s PoW but it starts to make sense when we realize that this increasing cost is counterbalanced by the increasing total value secured by the system.
Conclusion
In this first part, we have discussed why the average cost per transaction isn’t an adequate metrics for measuring the efficiency of Bitcoin’s PoW and why this efficiency should be defined in terms of the security of an economic history.
Based on this observation and two important properties of Bitcoin’s PoW (its global and cumulative effects) we’ve formalized the utility of PoW with a very simple mathematical formula defining the total number of bitcoin.days secured by the system.
At last, we have derived two metrics which both suggest that contrary to a widespread opinion, Bitcoin’s PoW is actually becoming more and more efficient.
In the next part of this series, we’ll discuss a new metrics highlighting how the efficiency of the system has evolved under the influence of mining and hodling behaviors.
Acknowledgments
I wish to thank @Beetcoin, Pierre P. and Stephane for theirs precious feedback and their patience. :)
A great thank you to @SamouraiWallet and TDevD for theirs feedback and their unfailing support of OXT.
Notes
(1) See Kocherlakota’s theory of “money [being] equivalent to a primitive form of memory” (R. Kocherlakota, Money is memory , 1996, Federal Reserve Bank of Minneapolis) and Luther & Olson’s paper Bitcoin is memory (2014)
Hodlers are the revolutionaries
By Dan Held
Posted August 31, 2018

My reflections on the important role hodlers play in developing Bitcoin’s network (and other cryptocurrency networks).
“In the beginning of a change the patriot is a scarce man, and brave, and hated and scorned. When his cause succeeds, the timid join him, for then it costs nothing to be a patriot.”— Mark Twain
Satoshi published the Bitcoin white paper on 10/31/2008, one month after the collapse of Lehman Brothers sent a shockwave through the financial system. Bitcoin was incepted in a time of absolute necessity. Trust had been lost in a world that ran on trust.
“The root problem with conventional currency is all the trust that’s required to make it work. The central bank must be trusted not to debase the currency, but the history of fiat currencies is full of breaches of that trust. Banks must be trusted to hold our money and transfer it electronically, but they lend it out in waves of credit bubbles with barely a fraction in reserve.” — Satoshi Nakamoto
Through intervention by central banks during the financial crisis, markets have become incredibly distorted, with risk/reward the most skewed its ever been in recorded history. Over ~ 9T of bonds trade with negative yield.
What is unique about the current period is that never before in observable history have so many countries had such long periods without sustainable surpluses. For example, the US has now run a deficit for 40 of the last 44 years (including 2012)
 How do you think this plays out?
“Prior to the 20th century, ordinary people could always flee to hard currency (gold) to save themselves from the effects of the failed, inflationist, policies of the central bank. This ended across much of the world in the 20th century as gold was outlawed.” —Vijay Boyapati
Never before in observable history have so many countries been off a precious metal type currency system for so long. Coming off the gold standard in 1971 helped create the conditions for almost unlimited credit and debt creation potential that would have been inconceivable through the annuls of economic history.
“So after 41 years of global fiat currencies and an unparalleled amount of debt that is proving very difficult to shift, we really are venturing into the unknown.” — Jim Reid
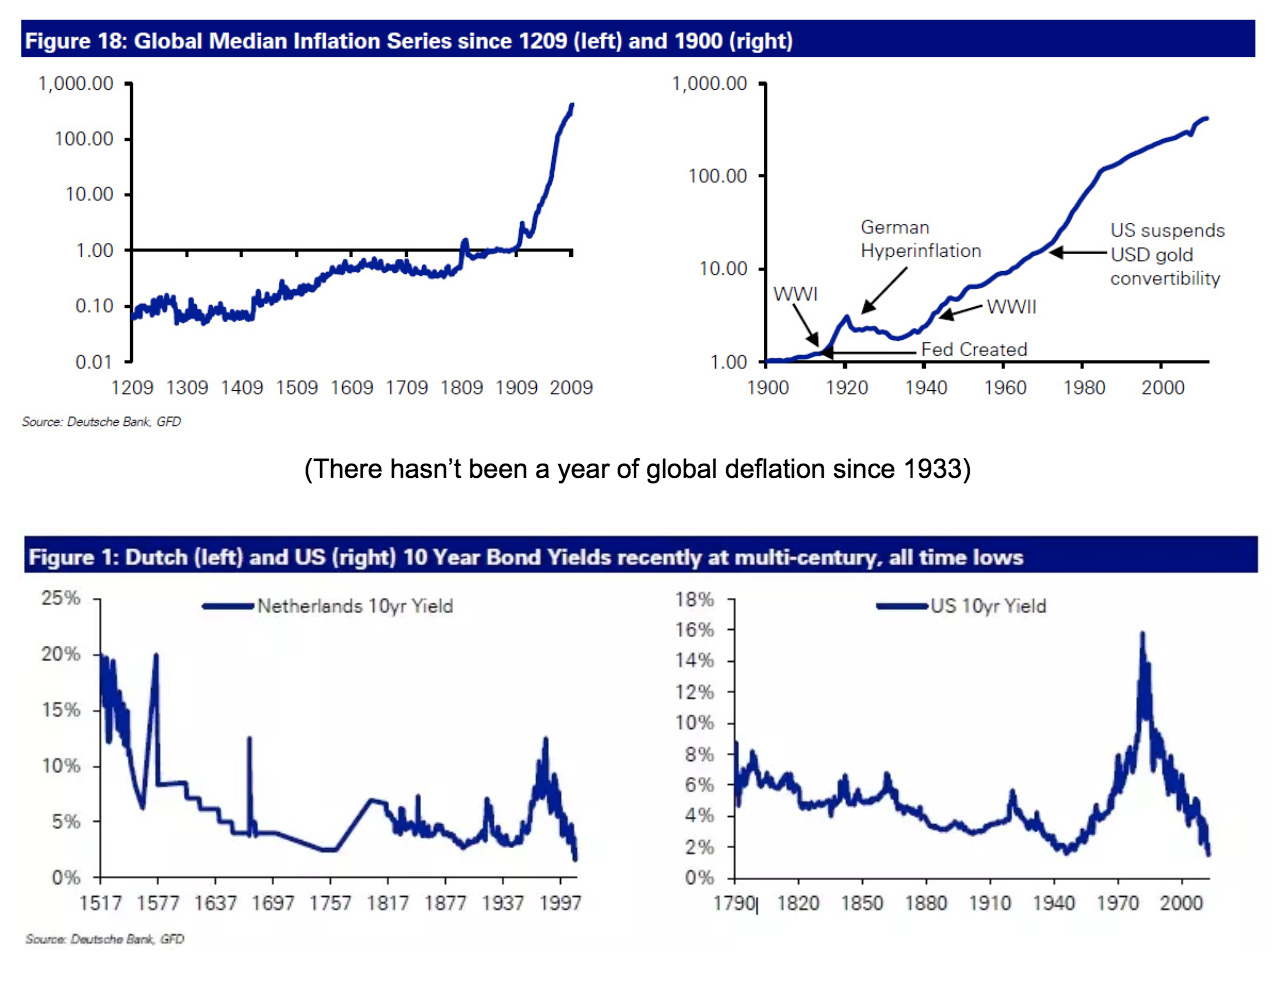
Bitcoin was created to build a new financial system, one that didn’t require trust, which adhered to principles of sound money. And why does sound money matter?
Money is the tool we use to signal consumer preference. By having a targeted and efficient means to relay consumer demand, producers can concentrate efforts towards goods and services the market desires most. Sound money facilitates this. With unsound money, the market loses the ability to relay its demands to producers. This is why socialism/centrally planned economies simply cannot function. The invisible hand mechanism is too profound and powerful to artificially replicate. Sound money is the catalyst to maximize the division of labour through the maximal efficiency of financial communication.
“Over and over again, the financial system was, in some narrow way, discredited…. the rebellion by American youth against the money culture never happened” — Big Short
Satoshi built Bitcoin for the believers in new financial system, the hodlers, the revolutionaries. The ones who were disenfranchised with the existing financial system. The ones who are attracted by the prospect of sudden and spectacular change in their life.
“In this sense, it’s more typical of a precious metal. Instead of the supply changing to keep the value the same, the supply is predetermined and the value changes. As the number of users grows, the value per coin increases. It has the potential for a positive feedback loop; as users increase, the value goes up, which could attract more users to take advantage of the increasing value.” — Satoshi Nakamoto
Satoshi needed to bootstrap the network with an incentive mechanism — the block reward which (a) controlled currency supply of Bitcoin and (b) created an incentive for people to protect the network.
“Hodling bootstrapped bitcoin into existence. Hodling increases value, which increases demand, hash rate, and network security, which, in turn, attracts new hodlers and devs. This self-reinforcing feedback loop drives bitcoin’s network effects, security, and value.”—@TobiasAHuber
Early hodlers believed in Bitcoin despite overwhelming negativity and false information (ex: labeled as a currency for money launderers and drug dealers, price fluctuations). Hodlers had stronger risk appetite to weather the volatility of being a first mover. They’re practitioners of skin in the game
“Don’t tell me what you think, show me your portfolio.” — @nntaleb
“Holding bitcoin is the exact opposite of speculation. A trade can be called speculative when the incentives for buying and selling is merely based on market sentiment. You hope to sell the product for profit despite the fact that it did not accrue any intrinsic value for society over the holding period. Holding of money does not have this downside, rather the opposite is true. By holding money you invest in the economy as a whole. Every time you choose to retain money you decrease the available amount in circulation…This leads to the increase of purchasing power per unit of that money. The result is that prices fall and all participants in that economy become wealthier. By holding Bitcoin the price per unit increases. The more people hold Bitcoin in the long run, the more volatility drops towards a gradual increase in price. This convergence towards a stable increase in price makes Bitcoin more attractive to new audiences, creating a feedback loop.”—Willem_VdBergh
“The increase in Bitcoin’s price has corresponding virality. And as it expands, hodling becomes popular with people with a lower risk appetite, pulling in more and more network effect into the Bitcoin black hole” — @robustus
With each of those boom/bust cycles we’ve seen Bitcoin redistributed from old hodlers to new hodlers via selling, decreasing the Gini Coefficient. In 2017 alone, we saw 15% of all BTC move out of old hodler hands.
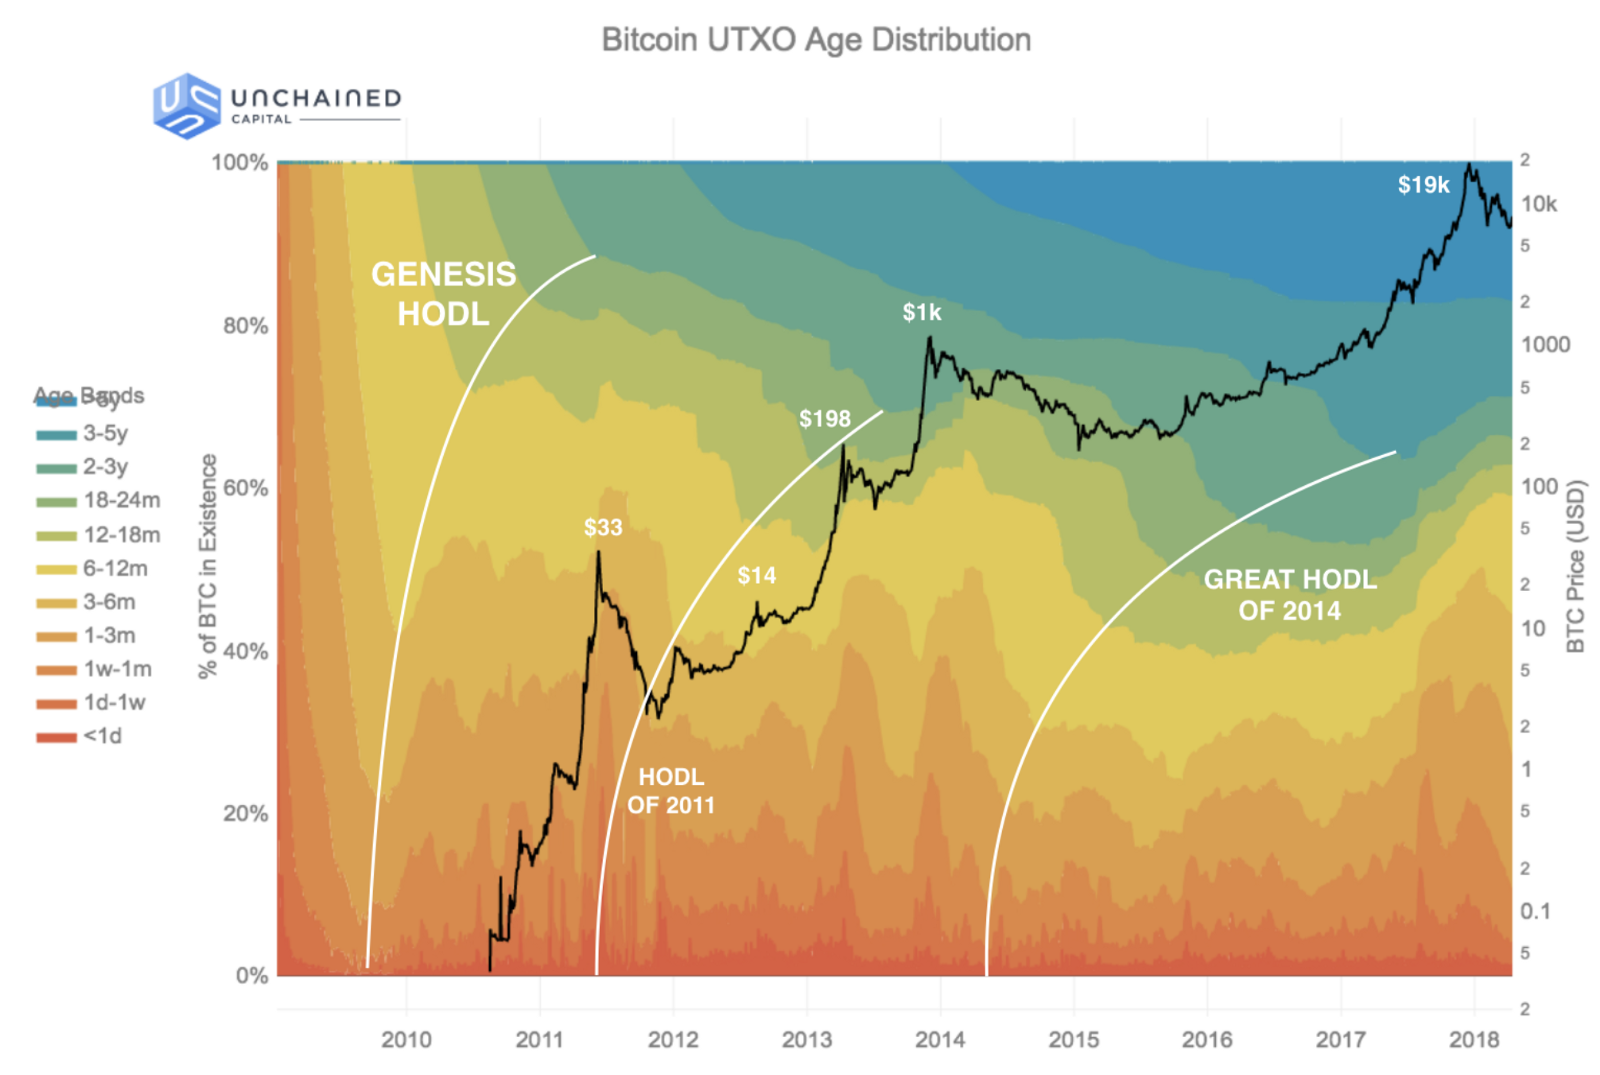
“Slowly, but surely, Bitcoin creeps further and further into the psyche of those in charge “ — Vijay Boyapati
Via the Lindy Effect, the longer Bitcoin remains in existence the greater society’s confidence that it will continue to exist long into the future.
“Protocols die when they run out of believers.” — Naval
The faith in a new financial system is what binds everything together. Bitcoin is not just a software project. It’s a method of coordination for a large group of people who face powerful adversaries. Bitcoin isn’t just a technological breakthrough, it’s also a social one.
“A stable and sustainable ideology must be the foundation of all cryptocurrencies. No amount of cryptography, or consensus protocol development will help a cryptocurrency with an unstable and bankrupt ideology. Stable ideologies allow communities to thrive”. — Kay Kurokawa
Money is a winner-take-all technology, driven by network effects. The crypto with the most hodlers, therefore, is the most demanded by consumers and will be the ultimate winner.
” Bitcoin is digital gold in the eyes of [Hodlers]. To some extent this group already operates on a Bitcoin Standard: investments are evaluated on their ability to yield a return in Bitcoin.” @ TuurDemeester
By owning Bitcoin, you become the central bank, the backbone of the financial system. Hodling isn’t about finding another buyer at a higher price someday in the future, if hyperbitcoinization occurs you’ll never have to sell.
The capital markets will be rebuilt by hodlers. The annual rate of return on your Bitcoin is the risk-free rate, with additional layers of return per unit of risk. For example, the Lightning Network provides a framework to measure the time-value of Bitcoin the Lightning Network Reference Rate or “LNRR.” — Nik Bhatia
Bitcoin promises an alternative for citizens across the world to keep their savings in a form of money that can neither be confiscated nor diluted. If Bitcoin grows much larger, it may force governments to become a voluntary organization. Through hodling we may finally be free.
Those who opt-in to Bitcoin (the red pill), are trading something abundant for something scarce, trading the past for the future, trading financial dependence for financial sovereignty.
Dawn of Bitcoin from Dan Held on Vimeo.