The Yin and Yang of Bitcoin
The Yin and Yang of Bitcoin
By LaurentMT
Posted September 3, 2018
This is post 2 of 3 in a series
“Countless words count less than the silent balance between yin and yang” - Laotzi
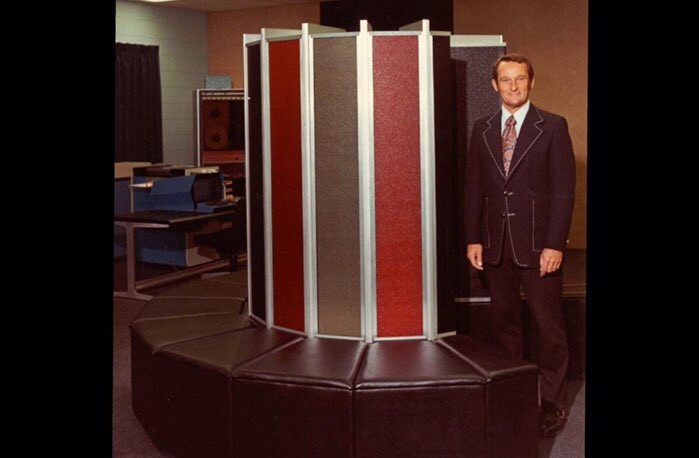
 Hodling & Mining, the two dragons of Bitcoin (photo: Panels of Dragons Yin Yang)
In the second part of this series, we’re going to define a new metrics called the Price-Performance Ratio of Bitcoin’s PoW (PPR). Our goal will be to analyze the evolution of the actual efficiency of the system and to identify the factors driving its dynamics.
After having defined this new metrics, we will first witness its “surprising” correlation with the bitcoin’s market price. Going a bit further in our analysis, we’ll study the role played by hodling and mining. We’ll then focus on a “strange” pattern displayed by the metrics (resistance levels) before concluding with an observation about the existence of PPR cycles.
Prologue: Price-Performance Ratio of a product
The Price-Performance Ratio (PPR) is a metrics used in economics and defined as the ratio of the price of a product to its performance (expressed in any unit making sense for expressing this performance).
The PPR is often used to illustrate the difference between “classic” and “new technology” products. Indeed, it can often be observed that “classic” products display a constant or increasing PPR while each new iteration of “new technology” products come with a lower PPR.
This phenomenon can be explained by the fact that production of “new technologies” usually begins at an inefficient level but each iteration benefits from works and investments done for previous versions (R&D, etc). It’s this cumulative effect which allows to decrease the PPR.
Moore’s law is a famous example of this phenomenon. When I was a kid (i.e. before I learnt that Moore’s law was a thing), the Cray 1 was in my imagination a kind of mythical beast which would forever remain out of my reach. The first commercial version of the Cray 1A was sold in 1977 for the equivalent of $37M (in today value). Guess what… This beast was less powerful than your smartphone…
 “Hello… Hello?” — Happy owner of a crappy smartphone
Price-Performance Ratio of Bitcoin’s PoW
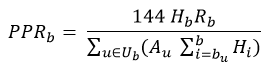
Ok. Let’s define our new metrics. For this, we’re going to consider the UTXO set after each new block as a new iteration of a “product”. Its performance will be measured by the total number of bitcoins.days secured it has accumulated. At last, we’ll approximate the price of this “product” by the reward associated to the block.
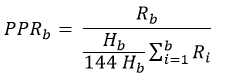
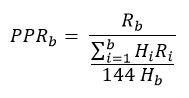
The equation for the PPR is
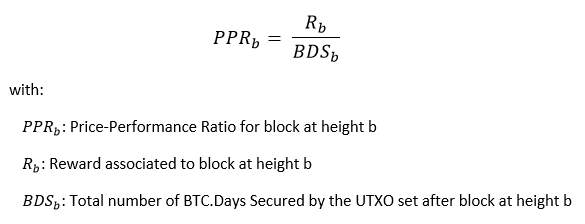
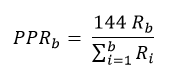
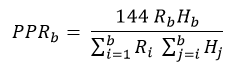
which can be rewritten as
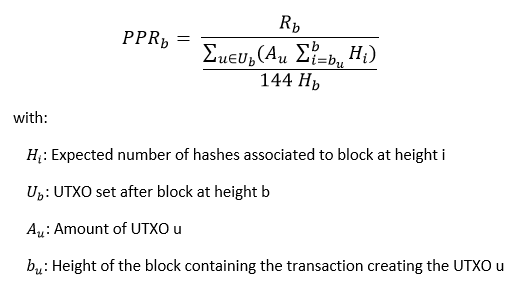
which is equivalent to
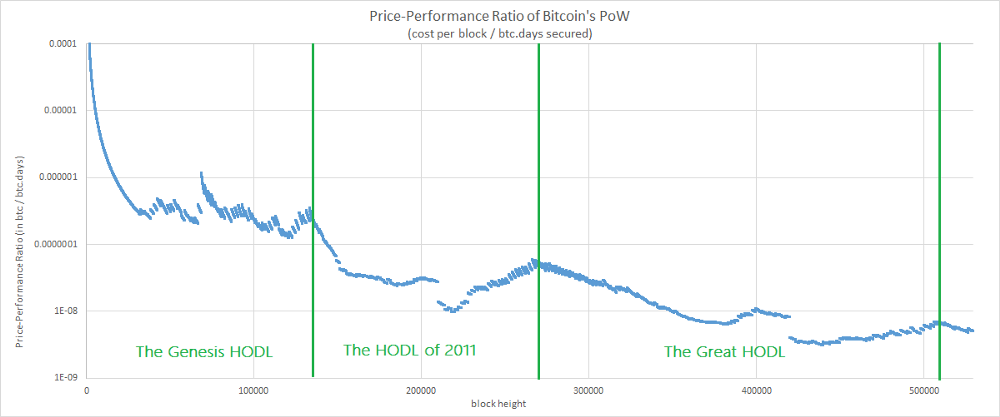
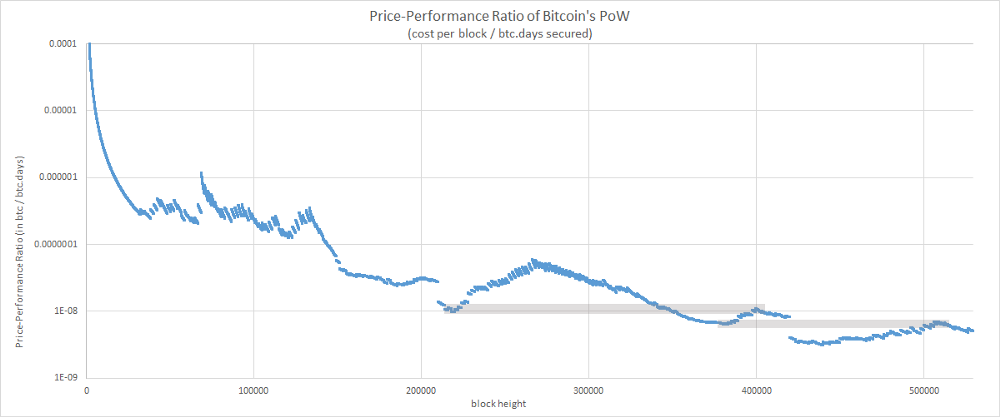
That gives us the following chart
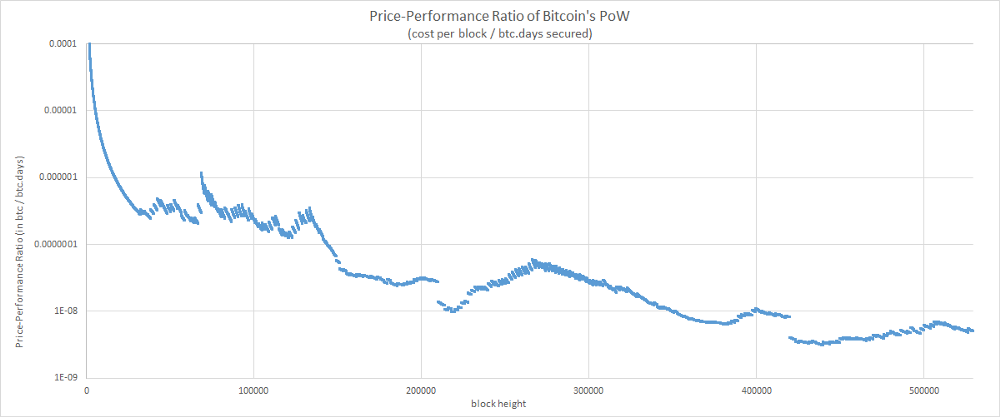
The chart displays a decreasing trend (i.e. an improving price-performance ratio) which is consistent with what we might expect from a system having a cumulative effect. And once again, the metrics suggests that the efficiency of the system has improved over time.
That being said, this curve is far less smooth than those obtained for our two previous metrics. It seems that the journey has been a bit rock & roll. Let’s try to understand what is happening here.
Singularities
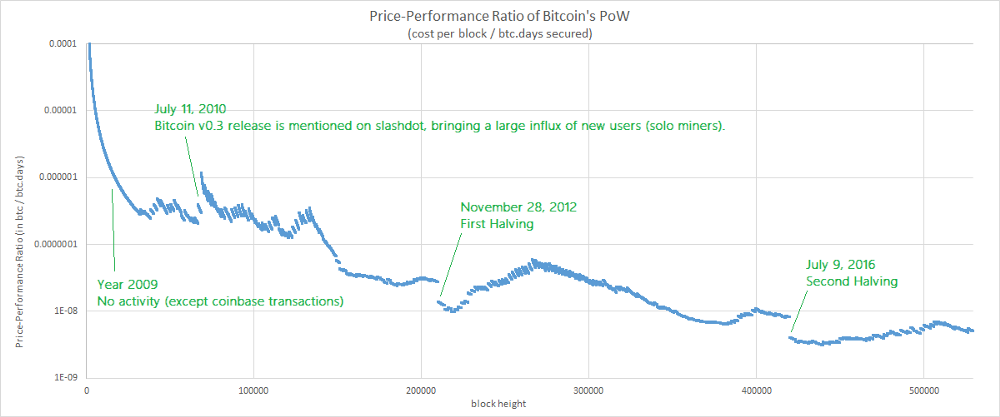
Let’s begin with an easy task and let’s try to identify the causes of a few singularities observed on the chart.
Bulls and Bears
All right. Now, let’s focus on the multiple oscillations of the curve and let’s add the dates associated to a few top and bottom values.
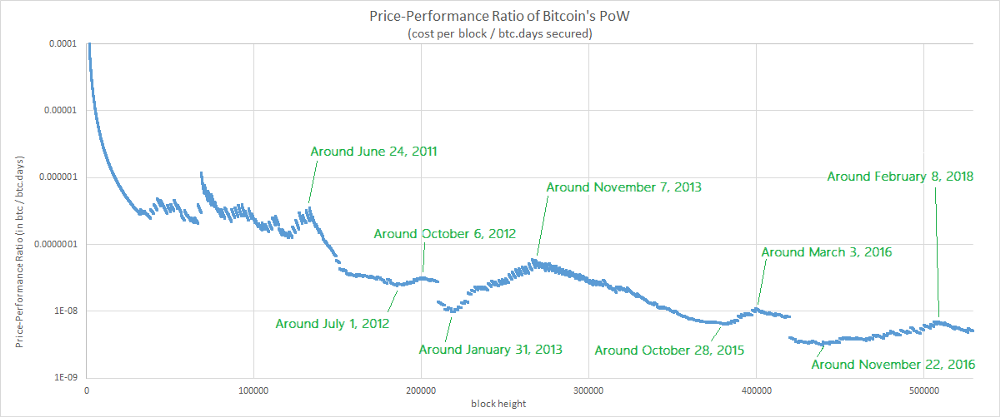
If you follow (even negligently) the multiple movements of the bitcoin’s market price, these dates may remind you something…
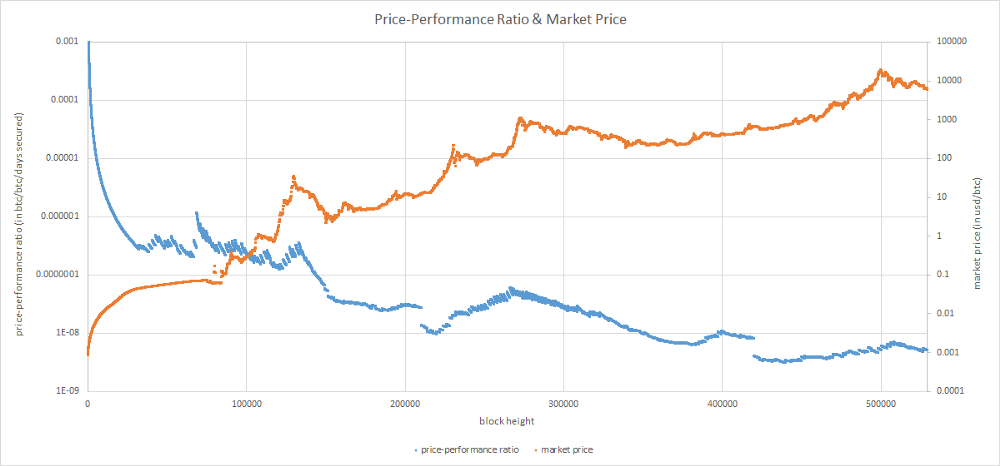
Price-Performance Ratio & Market Price (market price data from bitcoincharts and blockchain.com with a linear interpolation used for missing data points)
The chart suggests an interrelation between the PPR and the market price. At first, this might seem surprising since the market price isn’t a factor used in the definition of the PPR but it certainly makes more sense if we remind ourselves of multiple observations made in the past about the bitcoin’s market price driving changes in hodling & mining behaviors, two components of the PPR.
Let’s try to confirm this intuition with a deeper analysis of the relation existing between holding, mining and the PPR.
Yin (Hodling)
A few months ago, Unchained Capital published an excellent work about a phenomenon called the “Hodl Waves”. The main finding of this study was a repeated pattern of increasing hodling after each rally in bitcoin’s price. Considering that hodling is an integral part of the PPR, a convergence with the Hodl Waves model doesn’t seem absurd. Let’s check this hypothesis by plotting the dates associated to the three Hodl Waves.
The intuition seems good. We can already associate 3 “tops” with the Hodl Waves. Moreover, the chart suggests that the first phase of a new Hodl Wave (i.e. a period of increasing hodling) is correlated with an improvement of the PPR. It’s then followed by a degradation of the PPR which is correlated to the new rally in bitcoin’s price concluding the Hodl Wave.
Ok. Let’s try to get a better picture of the influence of hodling by determining its lower and upper bounds (i.e. when hodling is maximized and minimized). For this, we’re going to use a thought experiment and imagine two hypothetical versions of Bitcoin…
Upper bound: Bitcoin Steroïds
In the parallel universe of Bitcoin Steroïd, users seem gripped with a spending frenzy and they can’t help but spend their coins as soon as they receive them. An UTXO never “accumulates” more hashes than the ones added by the block including the transaction creating the UTXO (notwithstanding that freshly created coins must wait for a 100 blocks period before becoming spendable).
The PPR for Bitcoin Steroïd can be defined by the following equation (for the sake of simplicity, we omit the constraint over the maturity of coinbase transactions)
which can be rewritten as
Lower bound: Bitcoin Arctic
In the parallel universe of Bitcoin Arctic, store of value is all the rage. Basically, all users are miners trying to create new bitcoins that they’ll never transfer. Their goal is just to transfer their wealth into this digital store of value and keep it there forever.
Thus, the PPR for Bitcoin Arctic can be defined by the following equation
which can be rewritten as
Now, let’s plot our chart of the PPR with the two bounds defined by Bitcoin Arctic & Bitcoin Steroïd.
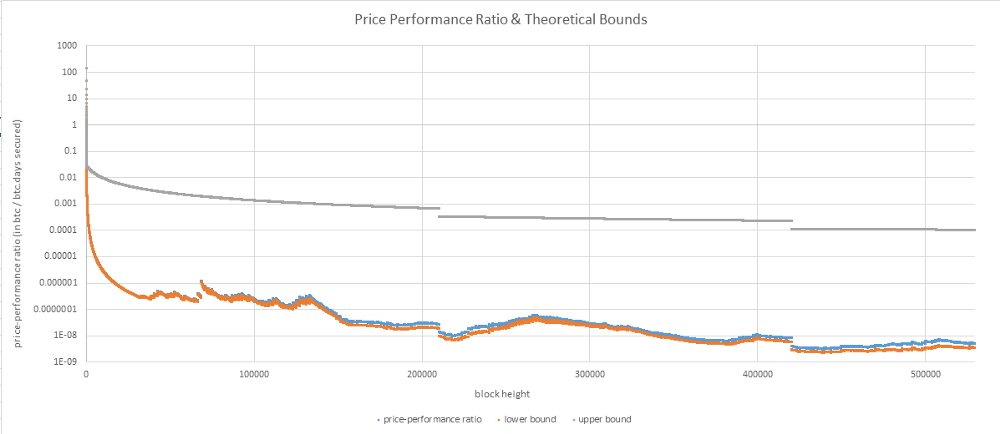
There are several observations to be made here.
First, it appears that since its inception, Bitcoin has operated in a mode very close to the lower bound defined by Bitcoin Arcticand their oscillations are quite similar.
On its side, the upper bound defined by Bitcoin Steroïd has a very different profile. Oscillations have disappeared. All we have is a smooth monotonically decreasing curve. This observation makes sense considering that in Bitcoin Steroïd, UTXOs don’t accumulate hashes for longer than a single block. Here, the main drivers are the increasing number of coins and the decreasing rewards. But there’s an expensive price to pay for this regularity; the PPR of Bitcoin Steroïd is several order of magnitudes higher than the PPR of Bitcoin or Bitcoin Arctic.
As a first conclusion, we can state that hodling has played an active role in the evolution of the efficiency of the system during the past 9 years.
Yang (Mining)
Let’s now focus on the influence of mining. For this, we’re going to plot a chart displaying the PPR and the expected number of hashes associated to the PoWs of past blocks.
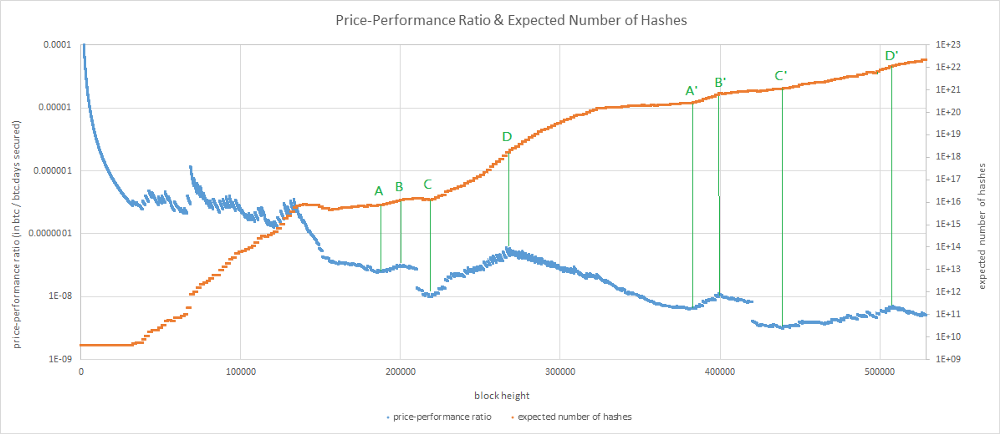
The chart displays a series of cyclic patterns composed of four phases:
- A=>B / A’=>B’ (a few months before a halving): Hashrate growth and PPR start to increase.
- B=>C / B’=>C’ (around the halving): Hashrate growth and PPR decrease.
- C=>D / C’=>D’ : Market price starts to increase. Hashrate growth and PPR increase again.
- D=>A / D’=>… : A “bubble” pops. Hashrate growth and PPR decrease again… until a new cycle begins.
Once again, these observations aren’t really surprising. They’re consistent with past observations made about the dynamics of bitcoin’s hashrate (anticipation of halvings, bull markets).
“Technical analysis”
While looking at the PPR chart, you may have noticed something else which seems a bit “weird”.
 PPR “Resistance” levels
Yep. That’s it. Some bottoms seem to act as a “resistance” for the top coming later. This observation puzzled me for a while. To better understand what is happening here, let’s play with a simplified model simulating the system.
First, we’re going to remove the halvings and difficulty adjustments. Then, we’re going to state that each block is rewarded by a single coin and that the first mined blocks require a single hash. Every N blocks, we’re going to simulate an increased market price instantaneously driving up the hashrate by a given factor (x2 or x3 for our simulation). That gives us the following result:
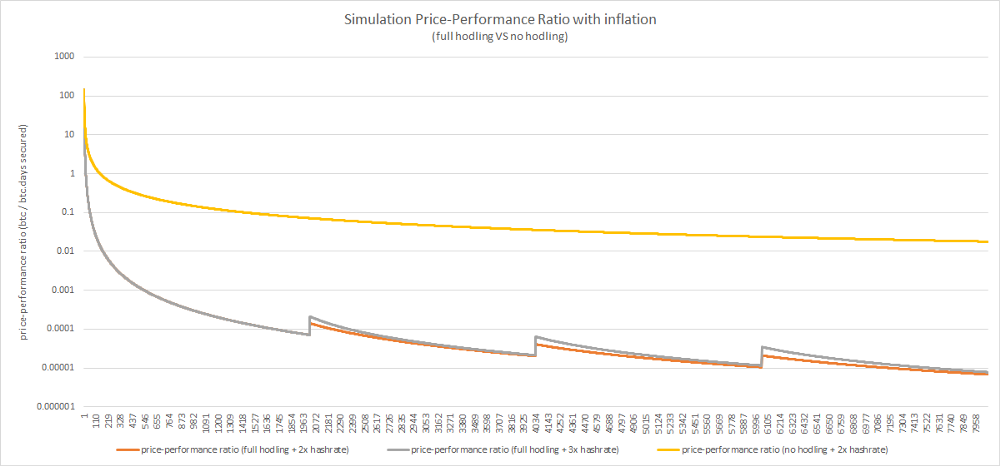
As you can see, this very simplified model is enough to reproduce the main characteristics of the PPR observed in the wild. It confirms that the occurrence of oscillations is correlated with a hodling behavior and it also suggests that resistance levels are influenced by the multiplying factor (the lower the factor the more the previous bottom “acts” as a resistance).
Let’s break some assumptions
There’s a last observation to be made about this phenomenon. You may have noticed that this “resistance” effect doesn’t seem to apply to all the tops.
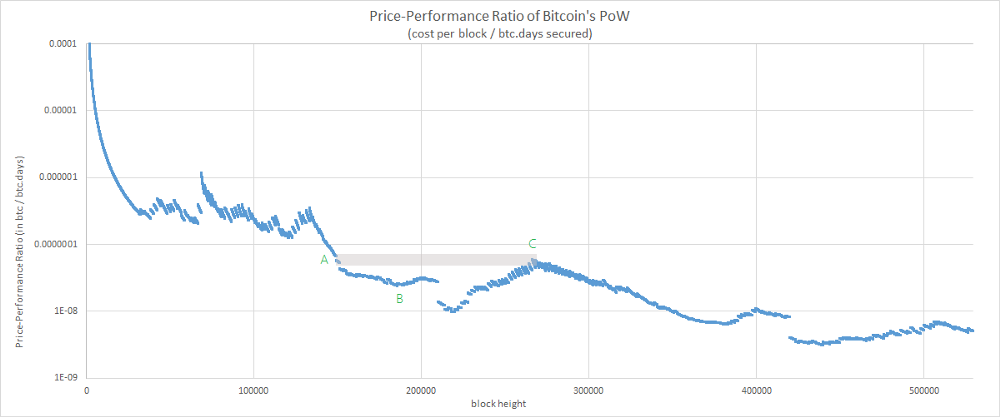
Indeed, according to our previous observation, we might expect that blocks around C find a “resistance” at the level of B instead of A. The interesting part of this observation is that A marks the beginning of a very unique period in the history of Bitcoin. For the first time, the hashrate strongly decreased and remained at this “low” level for an extended period which ended… around B.
It seems that what we’re witnessing here is the rare occurrence of a period breaking one of our assumptions (A5: “… the average amount of computing power dedicated to Bitcoin mining monotonically increases”). At this point, one of my hypotheses is that these top and bottom values might be associated to an equilibrium existing between hashrate, hodling behavior, mining rewards and market price. Anyway, the subject remains to be investigated further.
The PPR Cycles
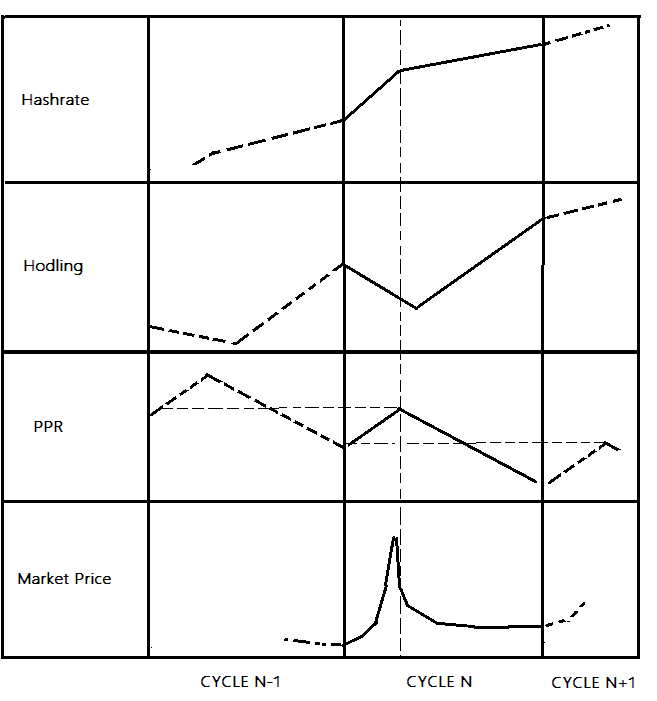
The last observation that we can infer from all the previous points is that the PPR follows a series of cycles which can be associated to bitcoin’s market cycles (anticipation of a halving or bull+bear cycle).
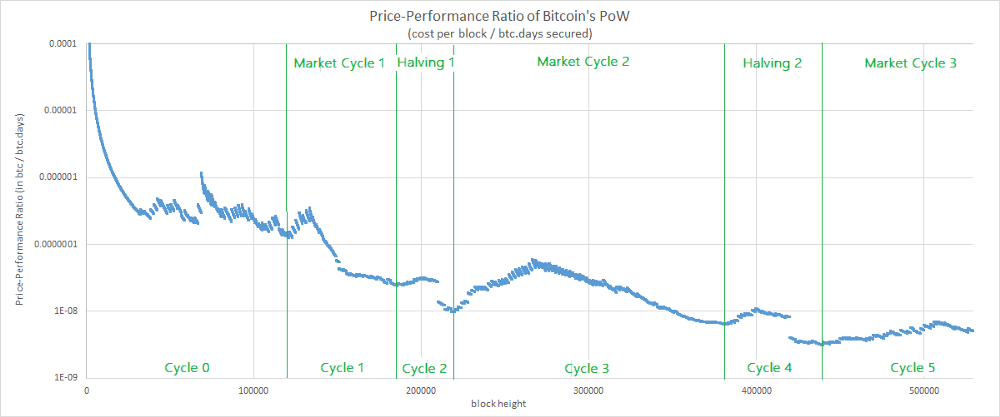 PPR Cycles
For each cycle, it can be observed that after a temporary period of degraded efficiency, the system has become more efficient. Specifically, each PPR cycle is composed of two phases:
- Phase 1: Market Price increases — Hodling decreases / Hashrate growth increases => PPR increases (the system becomes temporarily less efficient).
- Phase 2: Market price decreases / bubble pops — Hodling increases / Hashrate growth decreases => PPR decreases to a new low.
At last, it’s worth noting that the PPR cycles are slightly more fine-grained than the Hodl Waves. My hypothesis is that it can be explained by the fact that PPR cycles associated to bitcoin halvings primarily result from the influence of mining, a factor excluded from the scope of the Hold Waves model.
Conclusion
We have defined a new metrics taking into account the effects of mining and hodling over the actual efficiency of Bitcoin’s PoW.
Once again, the metrics suggests that the system has become more efficient over timebut the most interesting insights gathered from this metrics are certainly related to the analysis of its multiple oscillations. To my surprise, it remarkably synthetizes multiple past observations made about the interrelation between the market price and hodling & mining behaviors. It also highlights the influence of the market price over the efficiency of the system through its influence over hodling and mining.
At last, we have witnessed the existence of PPR cycles associated to market cycles (anticipation of halvings, bull+bear cycles) and we have observed that under our assumptions, the PPR value at the top of each cycle seems to reach a “resistance” around the initial PPR value of the previous cycle.
( Next part )
Acknowledgements
I wish to thank @Beetcoin, Pierre P. and Stephane for their precious feedback and their patience :)
A great thank you to @SamouraiWallet and TDevD for their feedback and their support of OXT.
At last, I wish to thank the team at Unchained Capital for their wonderful work on the Hodl Waves.
Annex A : Simplified schema of trends observed during a PPR Cycle