
Bitcoin Average Dormancy
| Crypto Words has moved! The project has migrated to a new domain. All future development will be at WORDS. | Go to WORDS |
Bitcoin Average Dormancy
New Views of a Classic On-Chain Metric
By David Puell & Reginald Smith
Posted June 20, 2019
Download Reginald’s research paper: Bitcoin Average Dormancy
Disclaimer: Nothing here should be considered trading or investment advice.
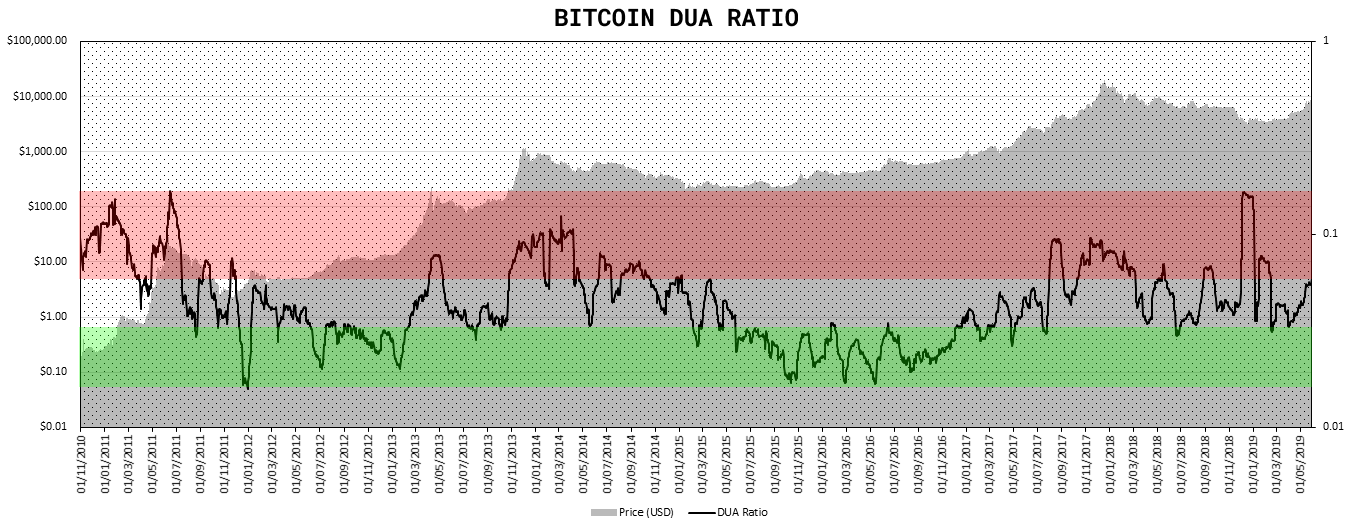
So what is average dormancy (or simply, “dormancy”)? First proposed by this article’s co-author Reginald Smith in 2018, it has not been given enough attention relative to its importance as one of the foremost metrics of BTC’s long-term economic health. In summary, dormancy is the average number of days destroyed per coin transacted in any given day, as per the following formula:
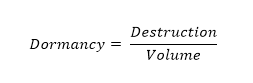
Here, destruction equals the total number of coindays destroyed, and volume equals the total number of coins transacted through the blockchain (and not at exchanges). This ratio describes the average number of days each coin transacted remained dormant, unmoved. The higher the dormancy, the older the coins transacted that day are on average, and the more old hands are releasing their bitcoins into circulation. In other words, average dormancy refers to spent or realized destruction relative to transactions.
Fearful Symmetry: Accumulation and Distribution
As pointed out in dormancy’s original paper, on-chain destruction and on-chain volume equate to being perhaps the two most important metrics of Bitcoin’s economic state; the reason being that, especially when compared as a ratio such as dormancy, they describe the state of what smart money is doing in the market at any given time—accumulation or distribution. Based on first principles, the following assumptions emerge:
- Accumulation describes the act of smart money (last-resort buyers) taking cheap coins from dumb money (panic sellers), while distribution describes the act of smart money (old hands) releasing expensive coins into the hands of dumb money (bag holders). Accumulation occurs at market bottoms and distribution occurs at market tops.
- Destruction describes the actions of mostly a single market actor: old hands selling or spending their bitcoins. Volume describes the actions of two market actors: buyers and sellers dealing with investor flows at different prices.
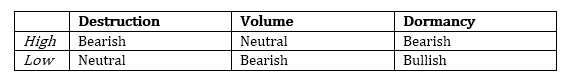
- High destruction is bearish (old smart holders releasing coins into circulation) and low destruction is neutral (since in itself it implies holders are maintaining their position but not necessarily that buyers are coming in). High volume in itself is neutral (high number of transactions between both buyers and sellers) and low volume is bearish (confirming no demand for the asset as per a lack of buyer’s activity). From the above, the following simplified matrix emerges:
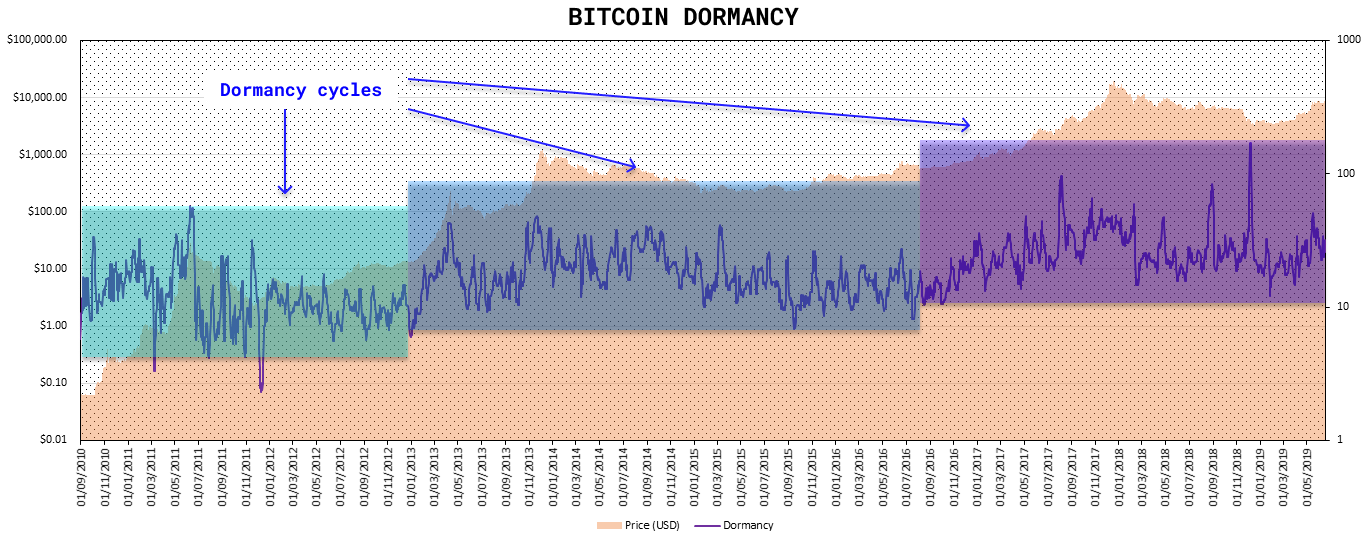
Dormancy integrates all these narratives into a single metric, by comparing both ratio components at all times, and displaying them in a simple oscillation by which, on a trending basis, high dormancy is bearish and low dormancy is bullish.
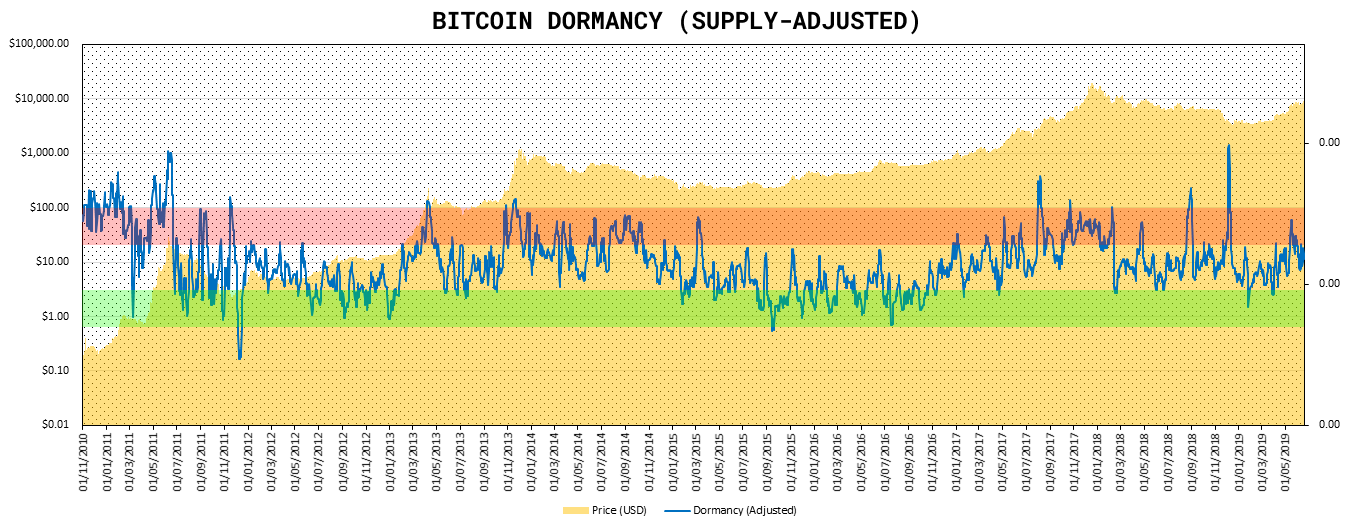
Supply-Adjusted Dormancy
Since the age of the market allows for an ever-increasing amount of destruction (the numerator of average dormancy), adjusting for supply (an increasing creation of minted coins) in the denominator seems to provide a clearer, more proportional historical oscillation that helps best visually detect the health of the market — or, in this case, dormancy per coin, calculated as follows:
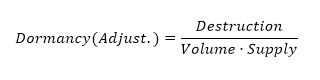
This formula produces the chart below:
DUA Ratio (by Reginald Smith)
Just as with pure transaction volume and its variants like NVT Ratio, NVT Signal, or Network Momentum, the dormancy concept has opened the door into a new inflow of indicators for long-term Bitcoin market diagnostics. What follows are two examples of this.
Dormancy-to-UTXO-Age Ratio measures the relation between dormancy and the average age of all UTXOs at any given time, calculated by taking the ratio of average dormancy of the last 30 days between the average of all HODL waves in existance, as follows:
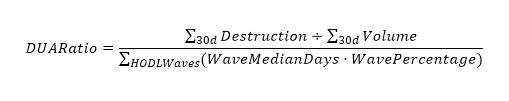
In which median days represents the median time of the HODL wave age band, and wave percentage represents the percentage of UTXOs in any given age band. In this particular case, both coindays destroyed and on-chain volume are aggregated throughout 30 days to smooth out the dormancy numerator.
Since dormancy measures the average holding time of continuously on-chain trading Bitcoin, the average age of UTXO, which includes bitcoin both in the HODL and lost states, is always longer — so average dormancy is always less than the average age of UTXOs. Therefore, the ratio is always less than one.
In periods where long-term holders accumulate (HODL) Bitcoin, the average dormancy is low and the average age of UTXO increases, lowering the ratio. When long-term holders offload their holdings to short-term traders, the average dormancy increases and the average age of UTXO decreases, raising the ratio. This tool is therefore useful in identifying market trends that often lead to HODL waves detecting periods of bitcoin selling by long-term holders in bull markets, and then re-accumulation after the onset of the bear market when the UTXO average age begins to rise and dormancy once again drops.
Dormancy Flow (by David Puell)
Another attempt at capturing phases in BTC’s market cycles, dormancy flow is calculated by dividing current market capitalization by annualized dormancy value (USD), as follows:
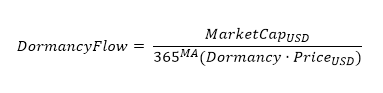
Dormancy flow provides the following chart, ideal for both bottom-catching historical global lows and assessing whether the bull market remains in relatively normal conditions:
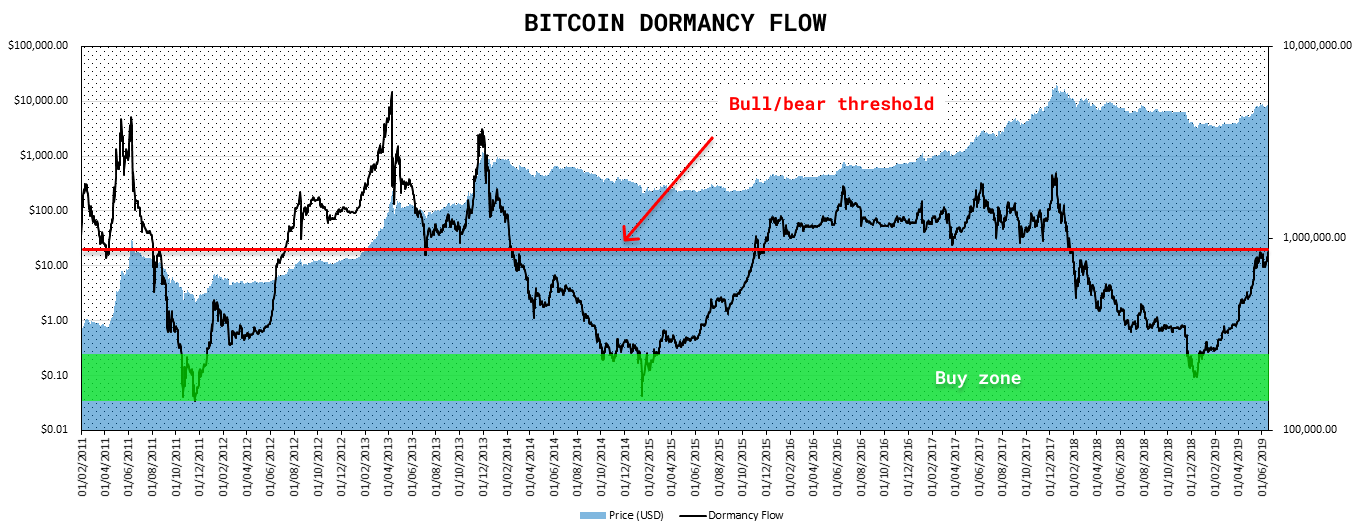
Whenever network value remains high relative to the yearly moving average of its realized dormancy in USD, the bull market can be considered as “healthy,” since price remains high relative to the market’s annualized spending behavior. Whenever dormancy value overtakes market capitalization at lowest longitudinal levels, the market can be considered in full capitulation — a good historical buy zone.
Caveats
- Destruction (dormancy’s numerator) is prone to false signals on daily variance. The most prominent example of this is last December, when the Coinbase exchange moved nearly 5% of Bitcoin’s total supply. To avoid misinterpreting these false positives, it is recommended to best use dormancy by looking at continuous trends in the oscillator (smoothed by medians or moving averages) as opposed to its daily noise.
- Just like with NVT and other on-chain metrics, dormancy should be viewed with an increasing caution for major fundamental shifts in detecting on-chain activity. Several recent or future developments in the Bitcoin ecosystem will ultimately contribute, at different stages and in different degrees, to a loss of power in the signals provided by these indicators. Examples of this may include: concentration of speculative liquidity in BitMEX and other exchanges, new custody solutions for institutions, the Lightning Network, sidechains, among others.
Acknowledgements
Many thanks to Willy Woo, Adam Taché, and Murad Mahmudov for their invaluable input and support in the improvement of this piece.
Sources and Data
- Smith, Reginal D. “Bitcoin Average Dormancy: A Measure of Turnover and Trading Activity.” Ledger, February 2018.
- CoinMetrics.io : Coindays destroyed, transaction volume, supply, and price data.
- Unchained-Capital.com: HODL waves data.
Authors
- Reginald Smith, independent researcher.
- David Puell, Head of Research @Adaptive Capital.