The Investment Case for Bitcoin
| Crypto Words has moved! The project has migrated to a new domain. All future development will be at WORDS. | Go to WORDS |
The Investment Case for Bitcoin
By Gabor Gurbacs
Posted October 08, 2019
We often refer to bitcoin as “digital gold” because, like the metal, it is a potential store of value. To determine if bitcoin has value, it is important to start with an understanding of the two types of value:
- Intrinsic value exists because an economic good—such as equities, real estate and consumable commodities like corn and oil—produces cash flow or has overt utility.
- Monetary value exists despite an economic good not having intrinsic value or because it has value beyond its intrinsic value. Examples include gold and other precious metals, artwork and gemstones.
Adding Bitcoin to an Investment Portfolio
If bitcoin is increasingly used as an asset with monetary value, what role might it play within an investment portfolio? Bitcoin may potentially increase portfolio diversification because of its low correlation to traditional asset classes, including broad market equity indices, bonds and gold.
Correlation (2/1/2012 – 7/31/2019)
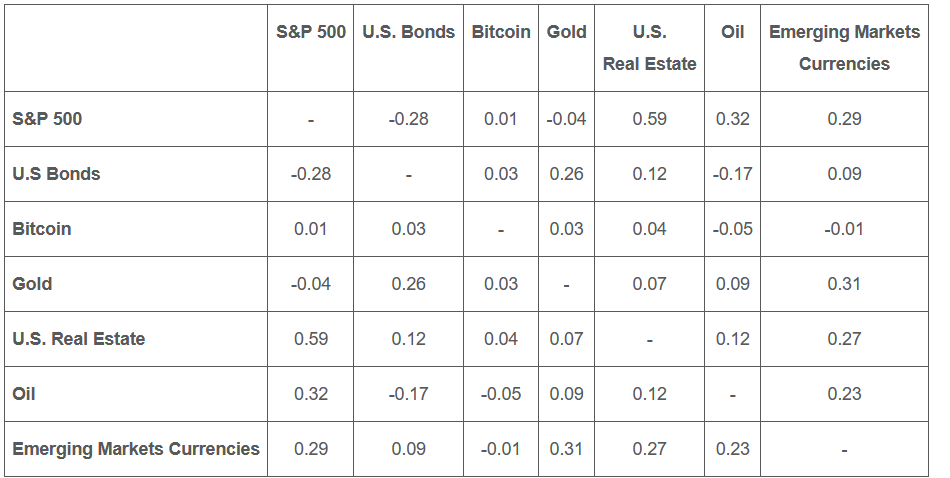 Source: Morningstar. Data as of July 31, 2019. U.S. Bonds is measured by the Bloomberg Barclays US Aggregate Index; Gold is measured by the S&P GSCI Gold Spot Index; U.S. Real Estate is measured by the MSCI US REIT Index; Oil is measured by the Brent Crude oil spot price, Emerging Market Currencies is measured by the Bloomberg Barclays EM Local Currency Government Index.
An allocation to bitcoin may also enhance the risk and return reward profile of institutional investment portfolios. As seen in the chart below, a small allocation to bitcoin significantly enhanced the cumulative return of a 60% equity and 40% bonds portfolio allocation mix while only minimally impacting its volatility.
Asymmetric Return Profile (2/1/2012 - 7/31/2019)
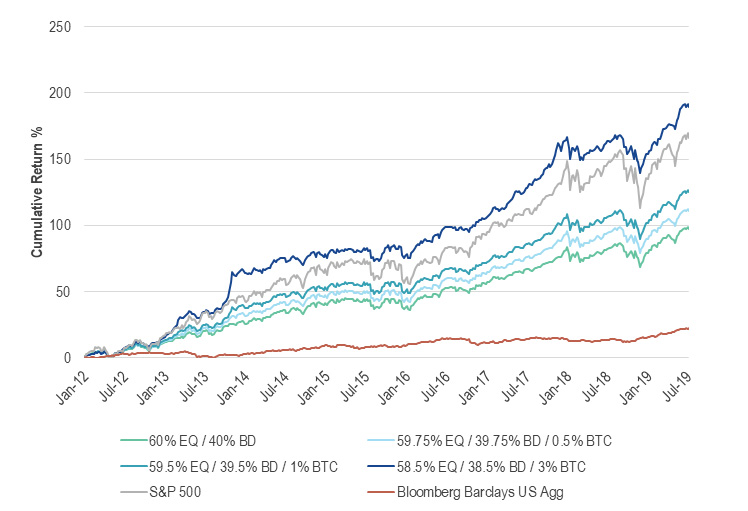 Source: Morningstar. Data as of 07/31/2019.
A look at the stock to flow ratio1 may also offer a view of bitcoin’s growth potential. The below stock to flow data suggests that bitcoin may have potential to grow, based on historical data and the scarcity characteristics of bitcoin, gold and silver.
Why Bitcoin Has Value: Scarcity
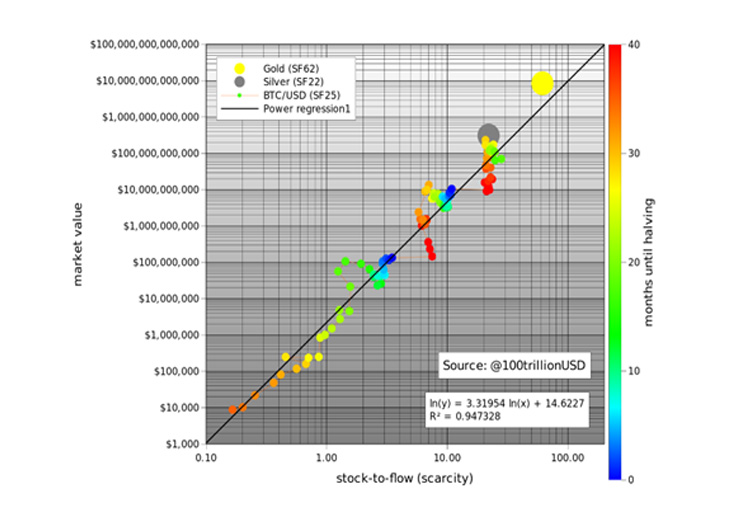 Source: Medium, “Modeling Bitcoin’s Value with Scarcity,” March 22, 2019.
Furthermore, bitcoin has “halvings” programmed into it. A halving is defined as a 50% block reward cut to bitcoin production rate, and they occur roughly every four years, with the next halving expected in May 2020. Given the scarcity induced by halvings, the price of bitcoin has historically increased following halvings.
MVIS CryptoCompare Bitcoin Index (2/1/2012 - 7/31/2019)
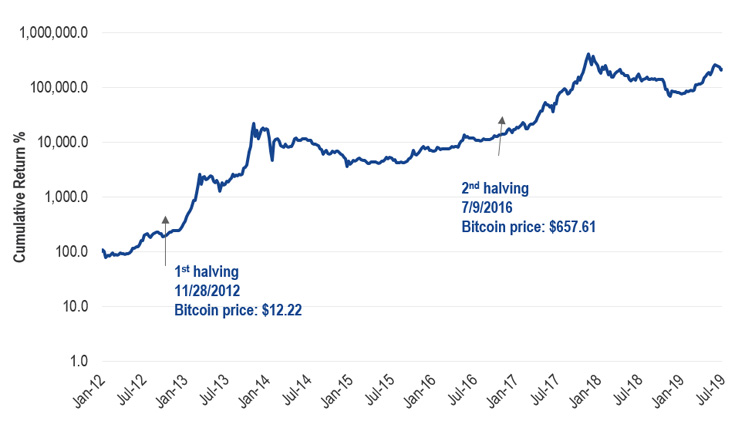 Source: Morningstar. Data as of 7/31/2019.
Bitcoin Adoption Continues
Bitcoin transactions have crossed 400,000 permission-less transactions per day, exhibiting significant network value.2 When looking at off-chain adoption and the number of applications being built on Bitcoin, we see a natural evolution taking place. Sidechains (such as Liquid by BlockStream) may be the next step in boosting Bitcoin adoption as they allow for scalability and customizations while retaining many of Bitcoin’s security properties. Built on top of the Bitcoin-blockchain, we believe the Lightning Network pushes the boundaries of Bitcoin payment capabilities with lower costs and faster speeds. Taking advantage of Bitcoin’s trust-minimized features, Microsoft is building a decentralized identity platform on the Bitcoin-blockchain. For more information, see the full presentation: The Investment Case for Bitcoin.
DISCLOSURE 1 The stock to flow ratio is defined as the amount of an asset that is held in reserves divided by the amount of that asset produced for a selected time period. 2 Source: Blockchain.info. Data as of 7/13/2019. This is not an offer to buy or sell, or a solicitation of any offer to buy or sell any of the securities/financial instruments mentioned herein. The information presented does not involve the rendering of personalized investment, financial, legal, or tax advice. Certain statements contained herein may constitute projections, forecasts and other forward looking statements, which do not reflect actual results, are valid as of the date of this communication and subject to change without notice. Information provided by third party sources are believed to be reliable and have not been independently verified for accuracy or completeness and cannot be guaranteed. The information herein represents the opinion of the author(s), but not necessarily those of VanEck. All indices are unmanaged and include the reinvestment of all dividends but do not reflect the payment of transactions costs, advisory fees or expenses that are typically associated with managed accounts or investment funds. Indices were selected for illustrative purposes only and are not securities in which investments can be made. The returns of actual accounts investing in natural resource equities, energy equities, diversified mining equities, gold equities, commodities, oil, industrial metals, gold, U.S. equities and U.S. bonds strategies are likely to differ from the performance of each corresponding index. In addition, the returns of accounts will vary from the performance of the indices for a variety of reasons, including timing and individual account objectives and restrictions. Accordingly, there can be no assurance that the benefits and risk/return profile of the indices shown would be similar to those of actual accounts managed. Performance is shown for the stated time period only. The S&P®500 Index: a float-adjusted, market-cap-weighted index of 500 leading U.S. companies from across all market sectors. The Bloomberg Barclays U.S. Aggregate Bond TR Index: is a broad-based benchmark that measures the investment grade, U.S. dollar-denominated, fixed-rate taxable bond market. The index includes Treasuries, government-related and corporate securities, MBS (agency fixed-rate and hybrid ARM pass-throughs), ABS and CMBS (agency and non-agency). The Bloomberg Barclays EM Local Currency Government TR Index: is a flagship index that measures the performance of local currency Emerging Markets (EM) debt. Classification as an EM is rules-based and reviewed annually using World Bank income group, International Monetary Fund (IMF) country classification and additional considerations such as market size and investability. The MSCI US REIT Index: is a free float-adjusted market capitalization index that is comprised of equity REITs and represents about 99% of the US REIT universe and securities are classified in the Equity REITs Industry (under the Real Estate sector) according to the Global Industry Classification Standard (GICS®). It however excludes Mortgage REIT and selected Specialized REITs. The S&P GSCI Gold Index: Is a sub-index of the S&P GSCI, provides investors with reliable and publicly available benchmark tracking the COMEX gold future. The index is designed to be tradable, readily accessible to market participants, and cost efficient to implement. The MVIS CryptoCompare Bitcoin Index measures the performance of a digital assets portfolio which invests in Bitcoin. The MVIS CryptoCompare Bitcoin Index is the exclusive property of MV Index Solutions GmbH (a wholly owned subsidiary of the Adviser). All S&P indices listed are products of S&P Dow Jones Indices LLC and/or its affiliates and has been licensed for use by Van Eck Associates Corporation. Copyright © 2018 S&P Dow Jones Indices LLC, a division of S&P Global, Inc., and/or its affiliates. All rights reserved. Redistribution or reproduction in whole or in part are prohibited without written permission of S&P Dow Jones Indices LLC. For more information on any of S&P Dow Jones Indices LLC’s indices please visit www.spdji.com. S&P® is a registered trademark of S&P Global and Dow Jones® is a registered trademark of Dow Jones Trademark Holdings LLC. Neither S&P Dow Jones Indices LLC, Dow Jones Trademark Holdings LLC, their affiliates nor their third party licensors make any representation or warranty, express or implied, as to the ability of any index to accurately represent the asset class or market sector that it purports to represent and neither S&P Dow Jones Indices LLC, Dow Jones Trademark Holdings LLC, their affiliates nor their third party licensors shall have any liability for any errors, omissions, or interruptions of any index or the data included therein. All investing is subject to risk, including the possible loss of the money you invest. As with any investment strategy, there is no guarantee that investment objectives will be met and investors may lose money. Diversification does not ensure a profit or protect against a loss in a declining market. Past performance is no guarantee of future results.
| Crypto Words has moved! The project has migrated to a new domain. All future development will be at WORDS. | Go to WORDS |