
The Golden Ratio Multiplier
| Crypto Words has moved! The project has migrated to a new domain. All future development will be at WORDS. | Go to WORDS |
The Golden Ratio Multiplier
Unlocking the mathematically organic nature of Bitcoin adoption
By Philip Swift (@PositiveCrypto)
Posted June 17, 2019
Disclaimer: Nothing contained in this article should be considered as investment or trading advice.
As Bitcoin continues to progress on its adoption journey, we learn more about its growth trajectory.
Rather than Bitcoin price action behaving like a traditional stock market share price, we see it act more like a technology being adopted at an exponential rate.
This is because Bitcoin is a network being adopted by society, and because it is decentralised money with limited supply, its price is a direct representation of that adoption process.
There are a number of regression analysis tools and stock to flow ratio studies that are helping us to understand the direction of Bitcoin’s adoption curve.
The new tool outlined in this paper brings an alternative degree of precision to understanding Bitcoin’s price action over time. It will demonstrate that Bitcoin’s adoption is not only following a broad growth curve but appears to be following established mathematical structures.
In doing so, it also:
- Accurately and consistently highlights intracycle highs and lows for Bitcoin’s price.
- Picks out every market cycle top in Bitcoin’s history.
- Forecasts when Bitcoin will top out in the coming market cycle.
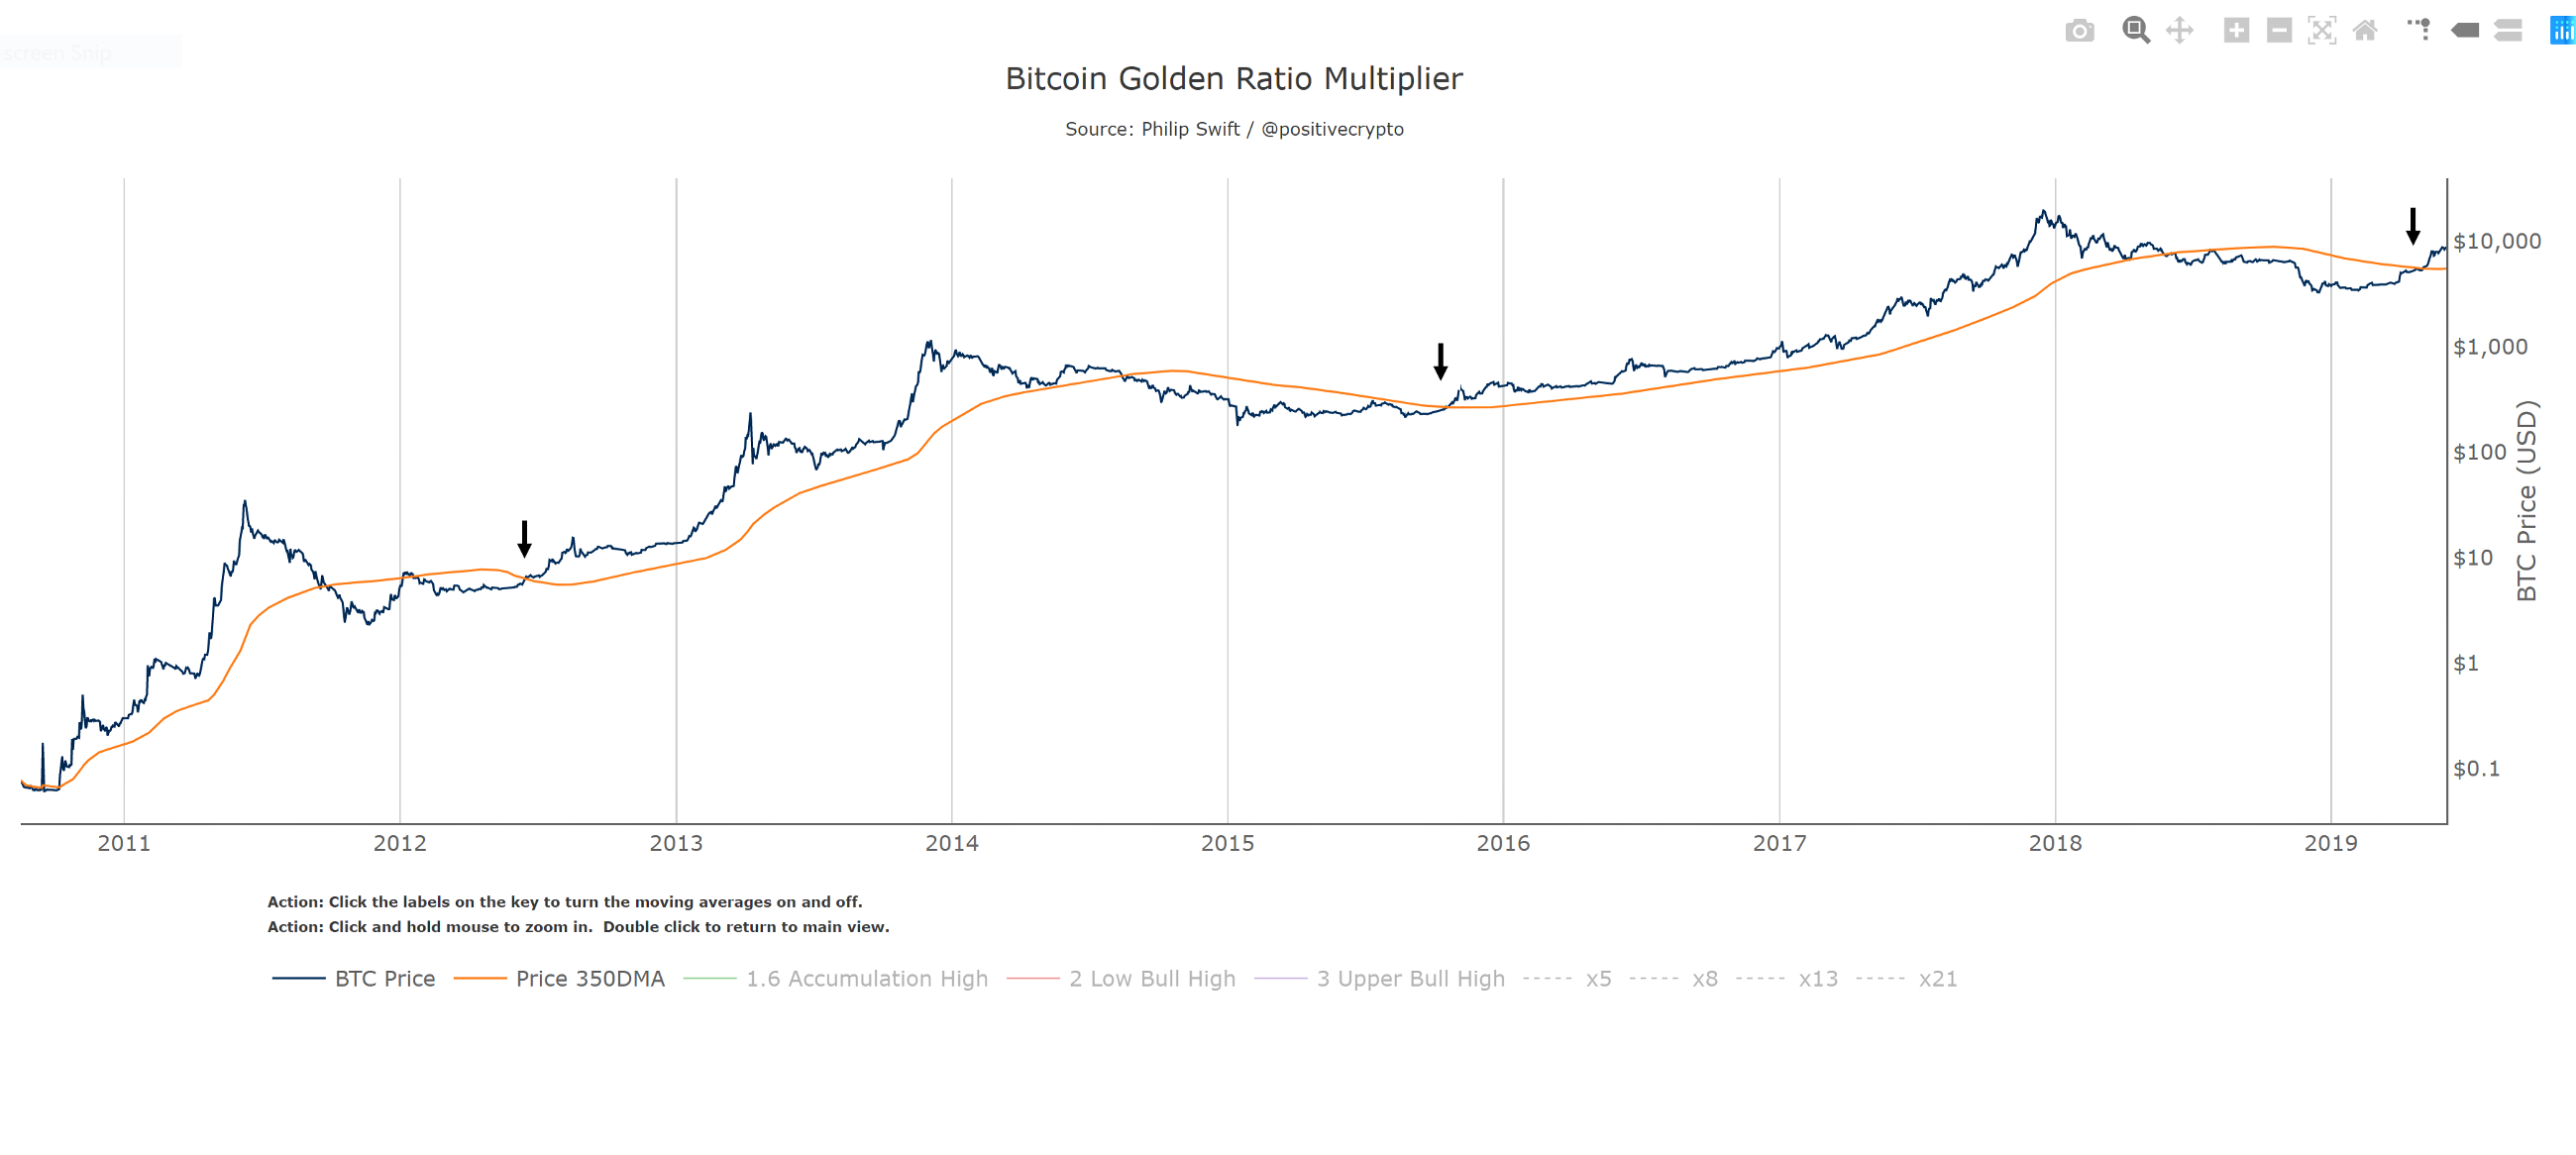
To begin, we will use the 350 day moving average of Bitcoin’s price. It has historically been an important moving average because once price moves above it, a new bull run begins.
The new insight comes when we multiply the 350 day moving average (which we will refer to as the 350DMA) by specific numbers. Those mathematically important numbers are:
The Golden Ratio = 1.61803398875
Fibonacci Sequence = 1, 1, 2, 3, 5, 8, 13, 21…
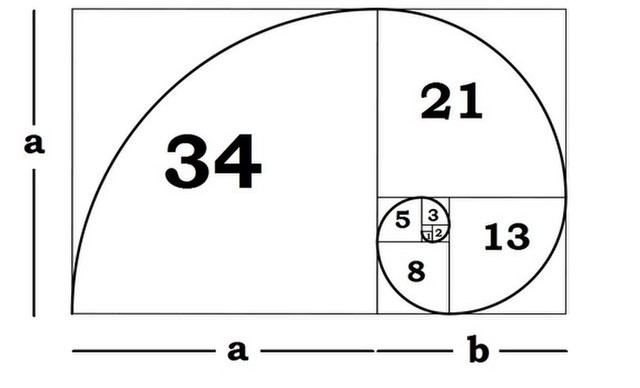
You can use these hyperlinks if you need a refresher on the importance of the golden ratio or Fibonacci sequence in nature and mathematics. But we see them consistently throughout life whether it is in the pattern of how plants grow, the structure of hurricanes, or even trader behaviour in financial markets.
Building the cyclical layers
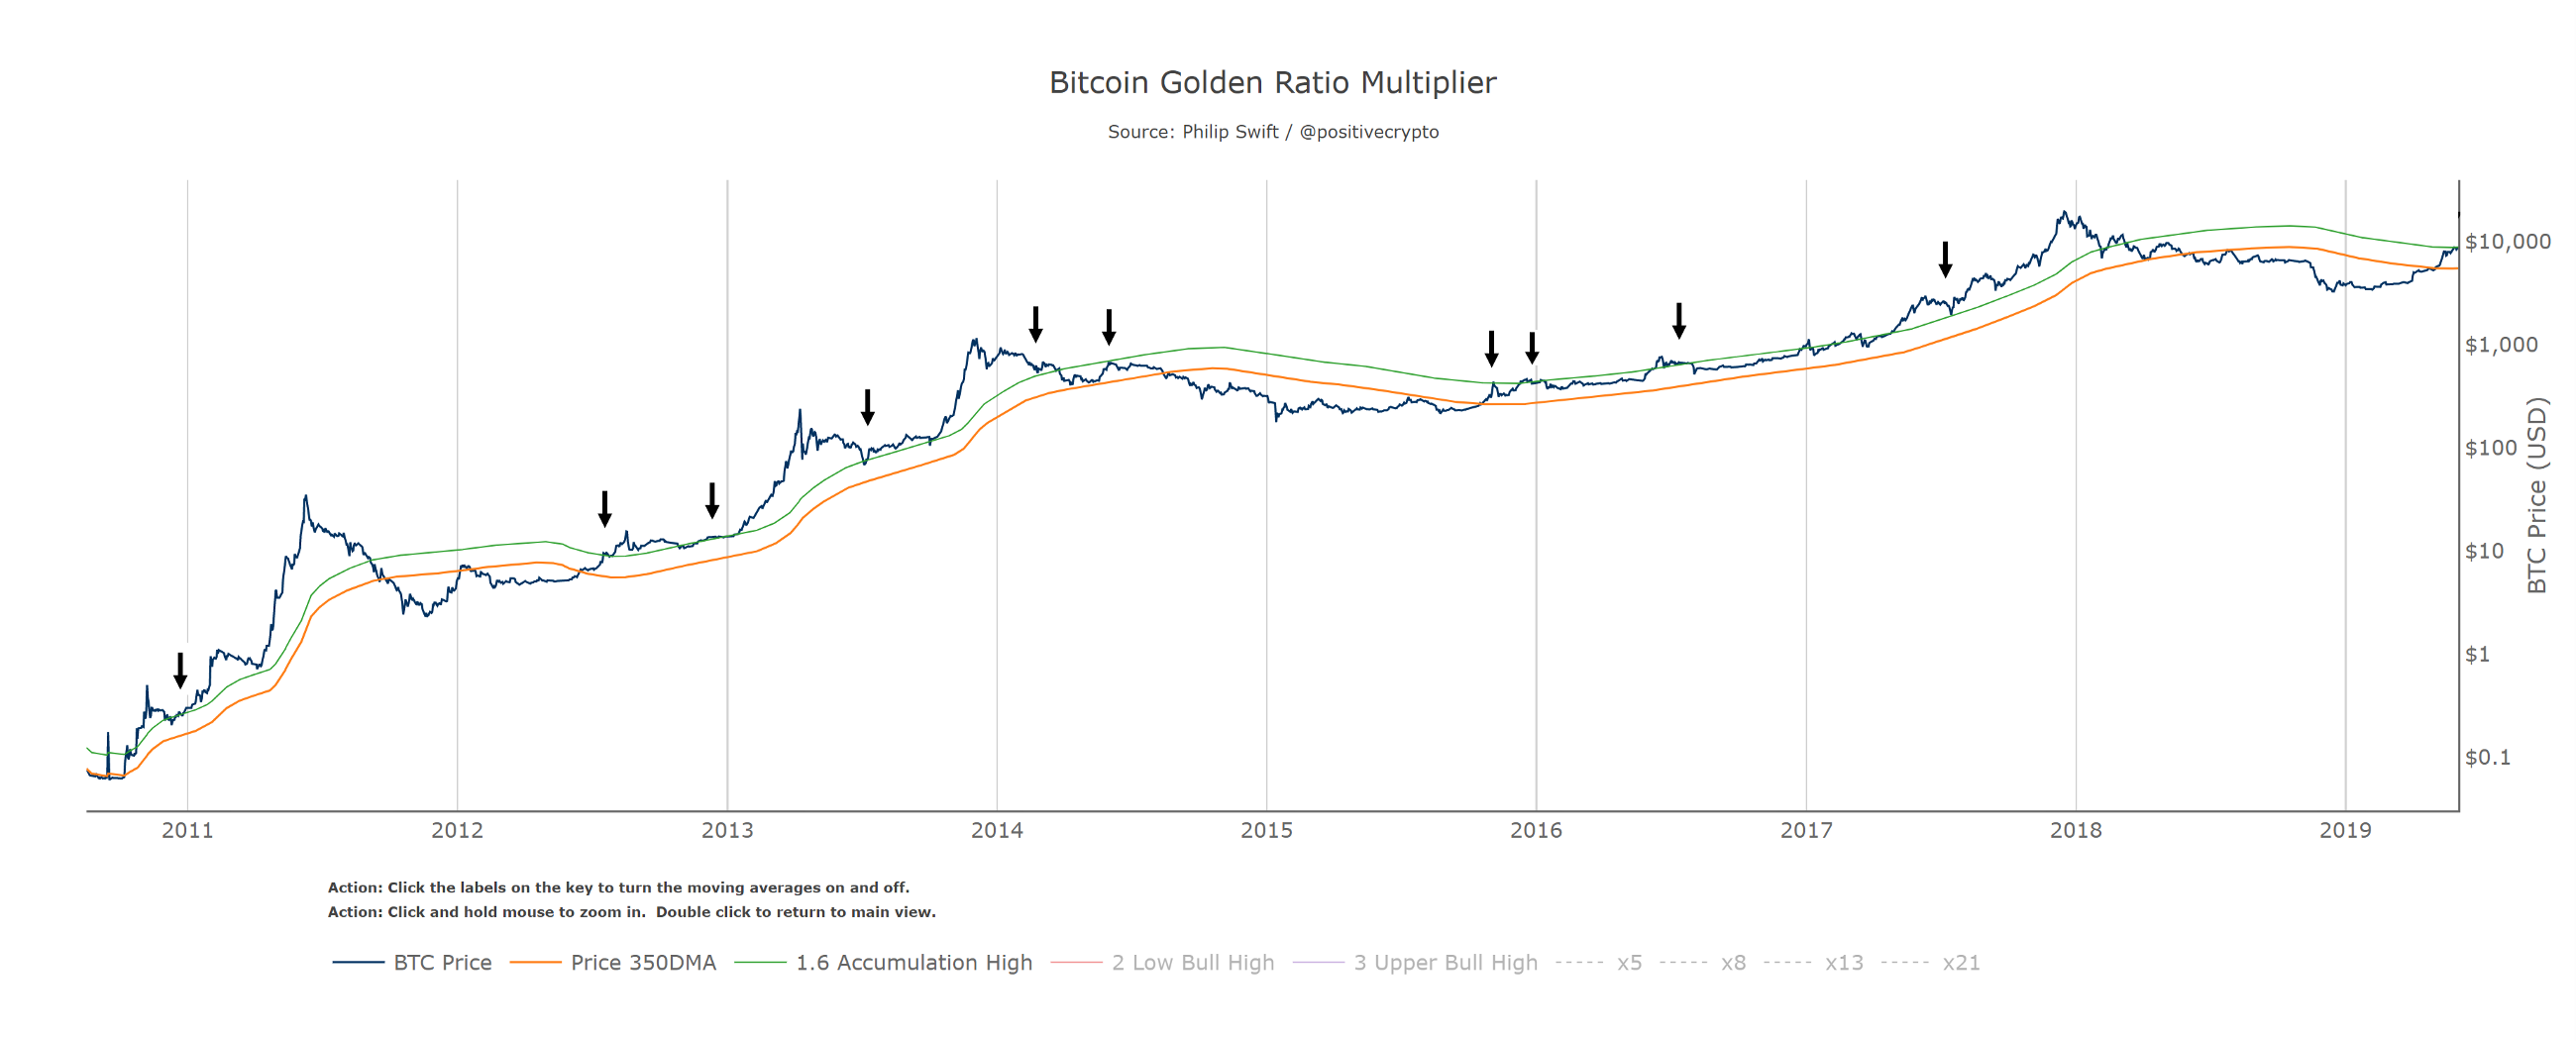
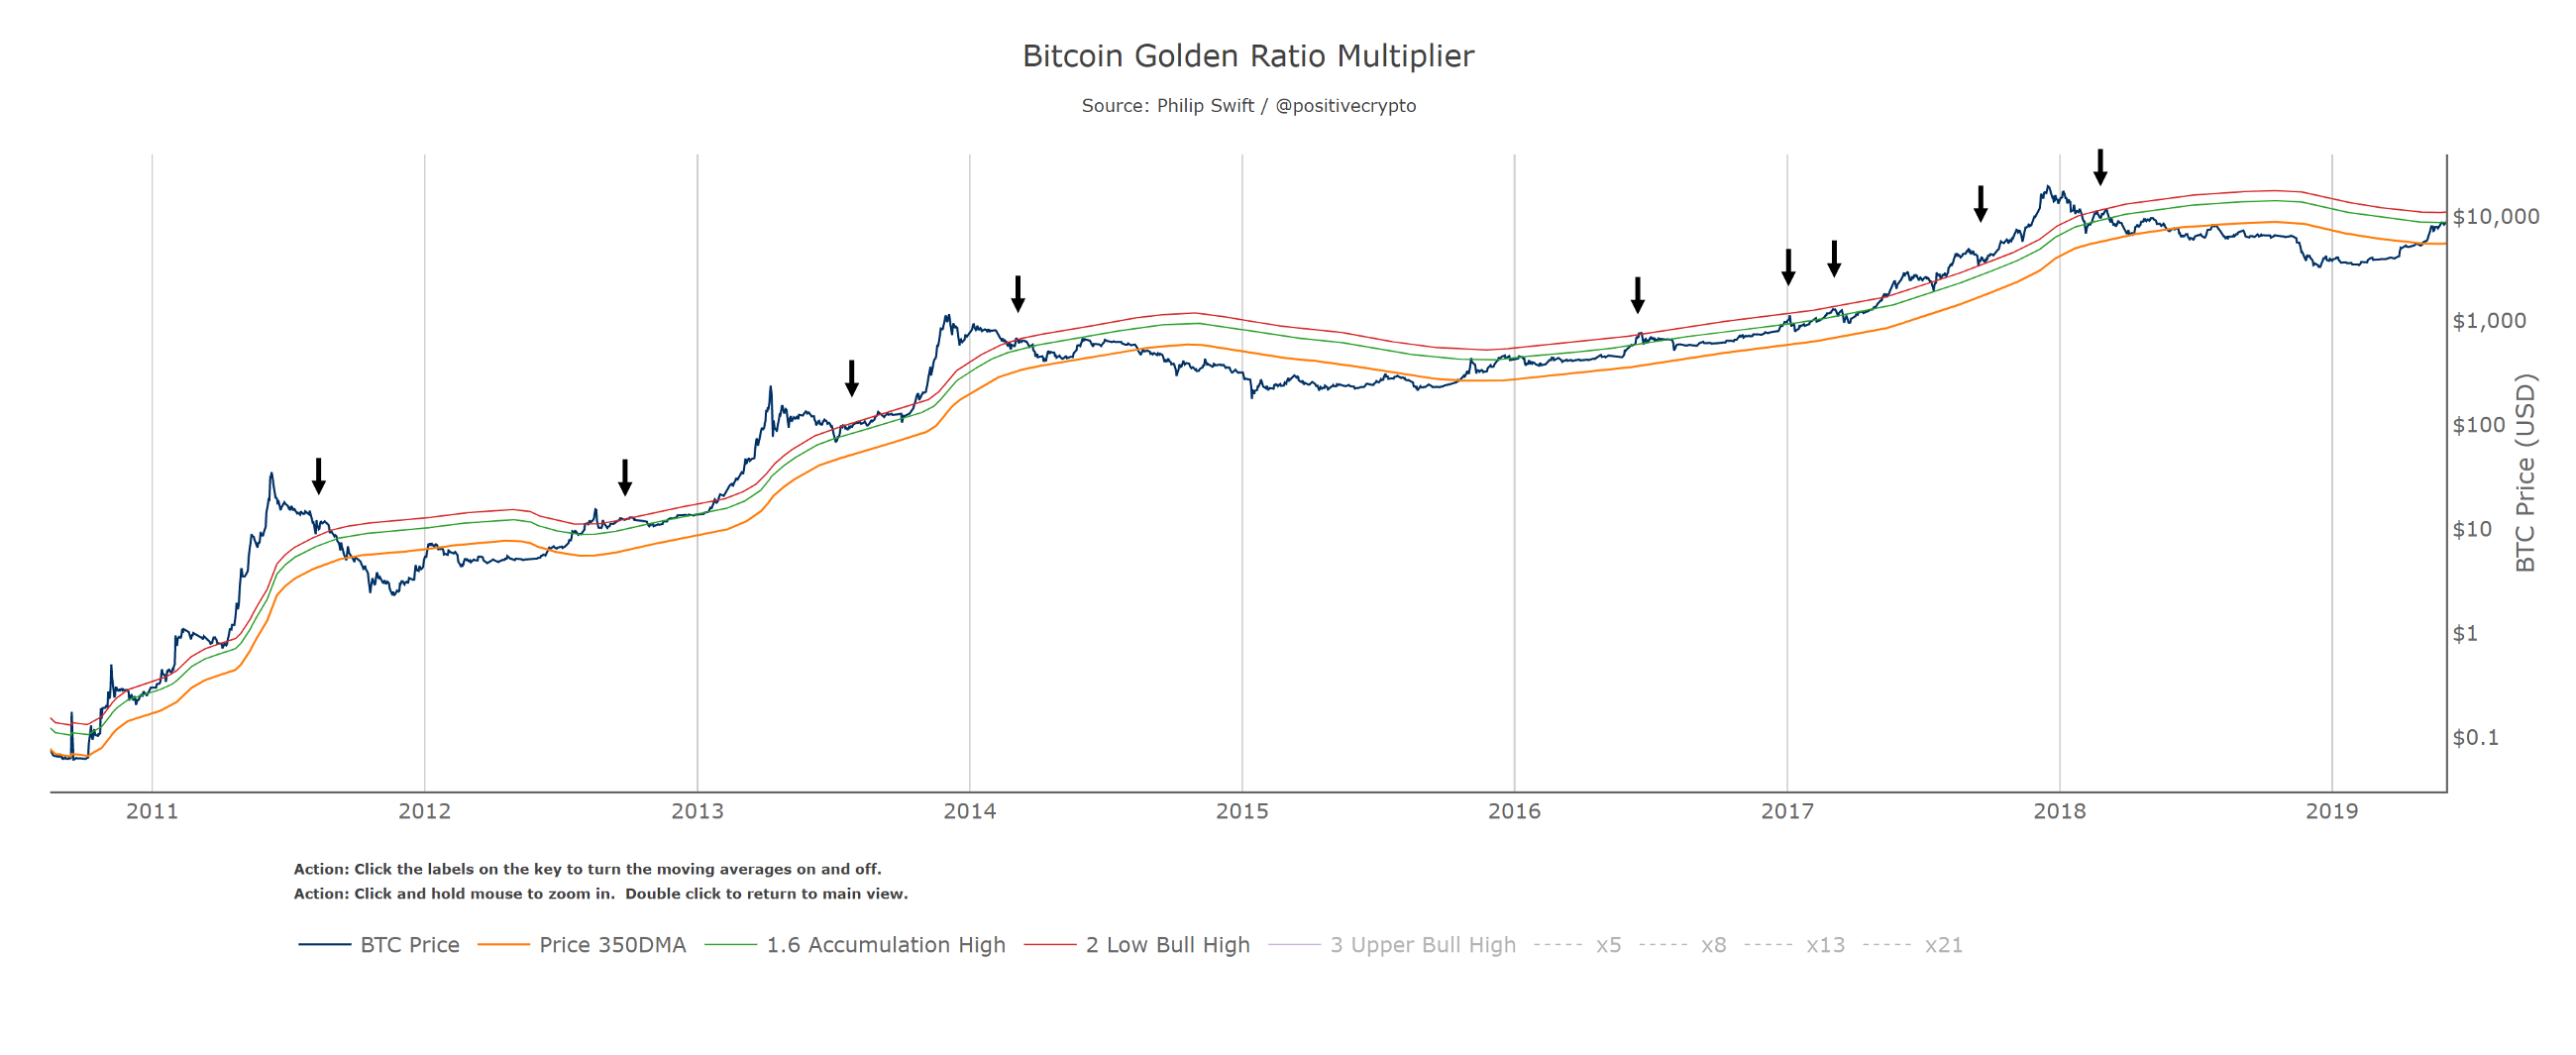
We will start with the Golden Ratio of 1.6 (rounded here to one decimal place).
If we take the 350DMA (orange line) and multiply its value by 1.6, we create a new line above it, the 350MA x 1.6 (green line).
We then discover in the chart below how this newly created green line has in fact acted as support and resistance throughout Bitcoin’s history, examples of which are highlighted by the arrows on the chart:
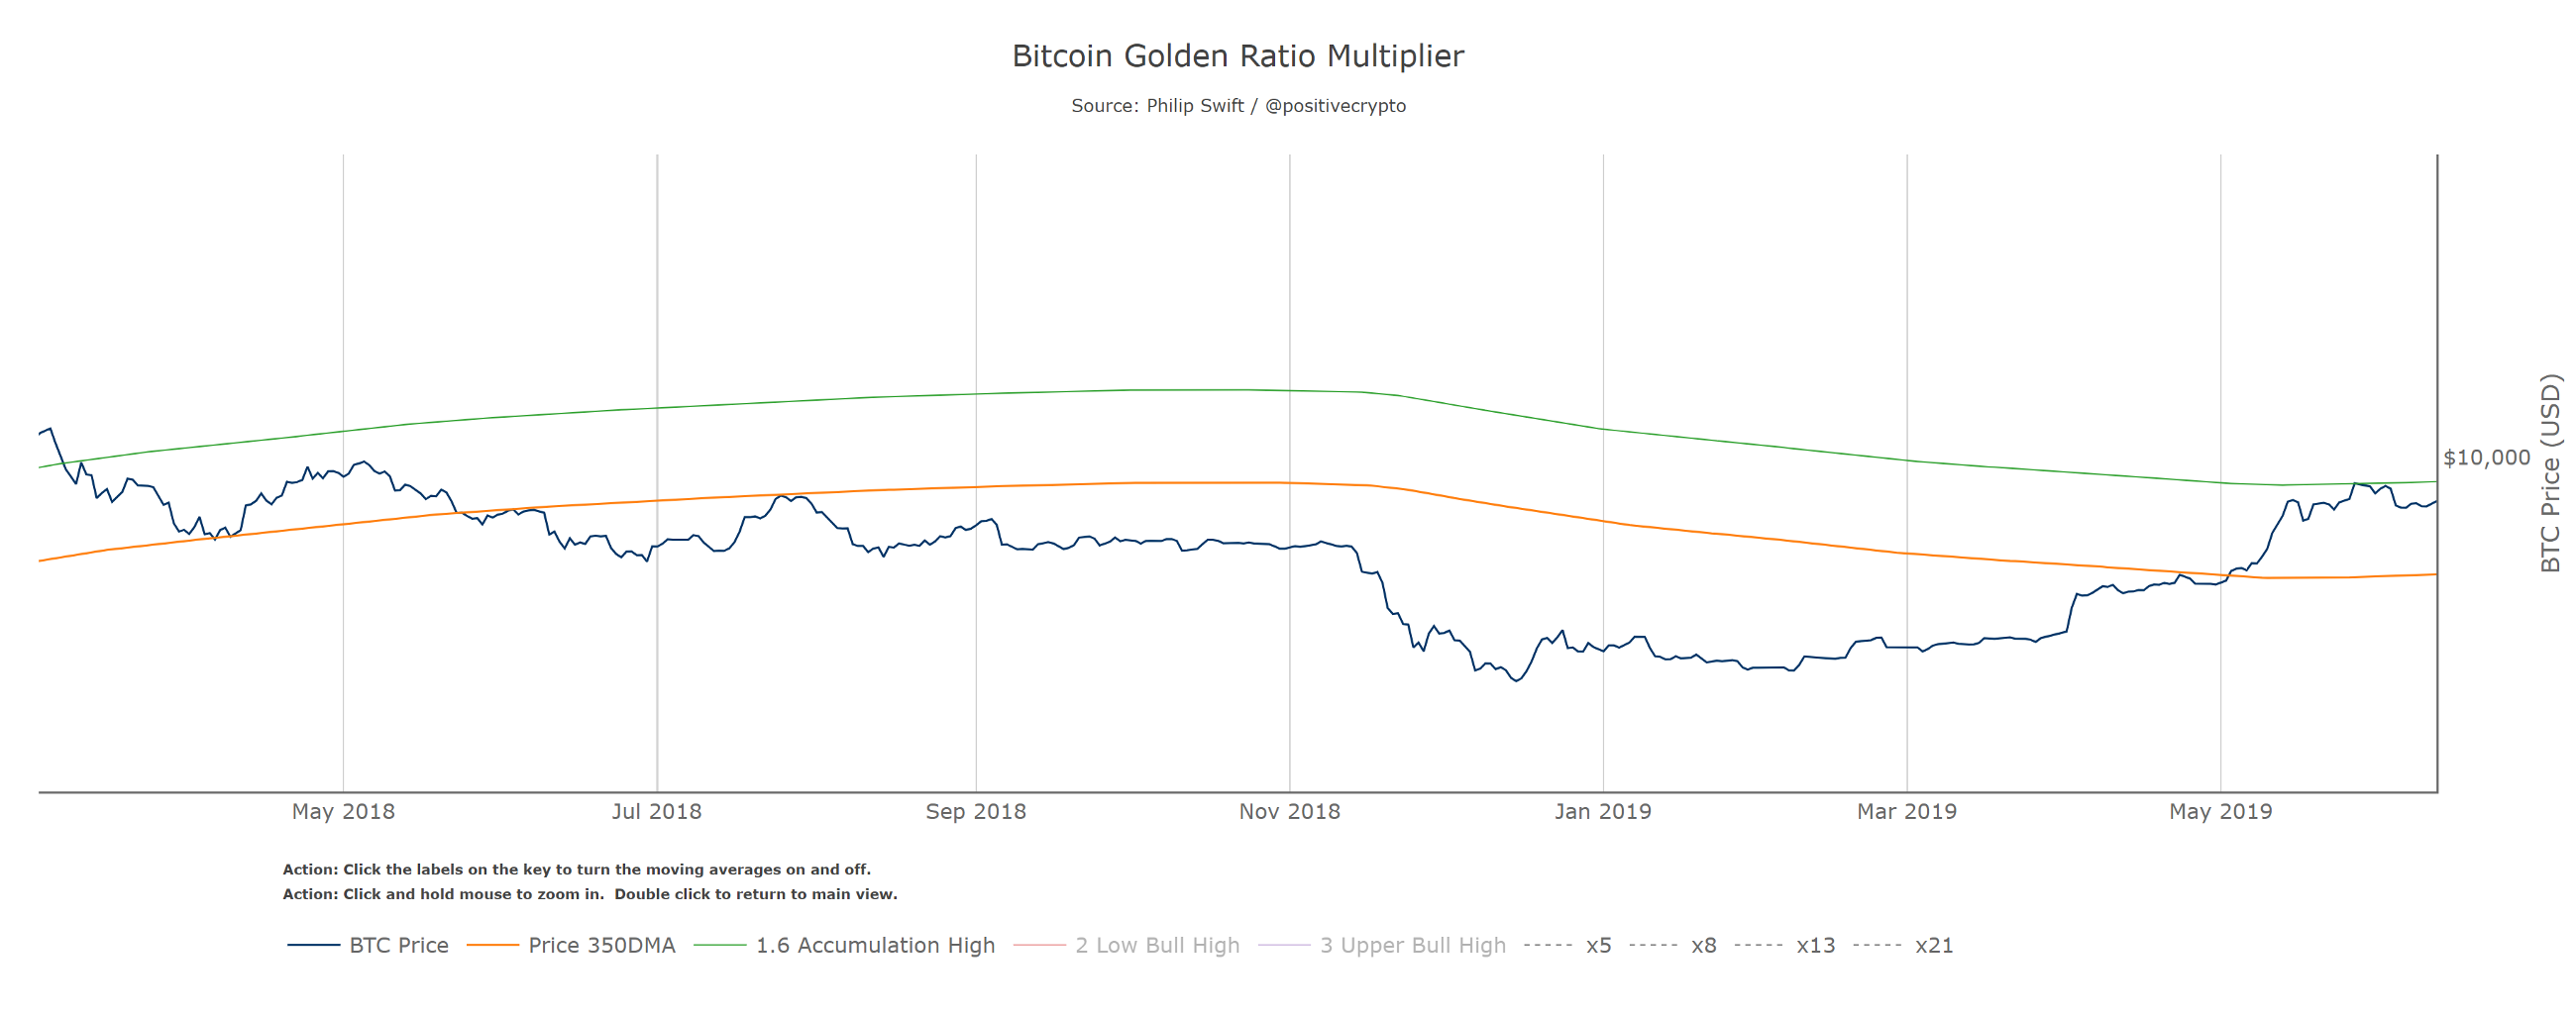
It is also worth noting that the 350DMA x 1.6 line acted as resistance in the parabolic price move from the Dec 2018 low. Rejecting price perfectly on the first touch and causing a $1,500 pullback before approaching it again and likely breaking through at the time of writing:
Things become more interesting when we then start to multiply the 350DMA by each number in the Fibonacci sequence: 1, 2, 3, 5, 8, 13, 21, etc.
Given that multiplying the 350DMA by 1 would not change its value, we start with the next number in the sequence, which is 2.
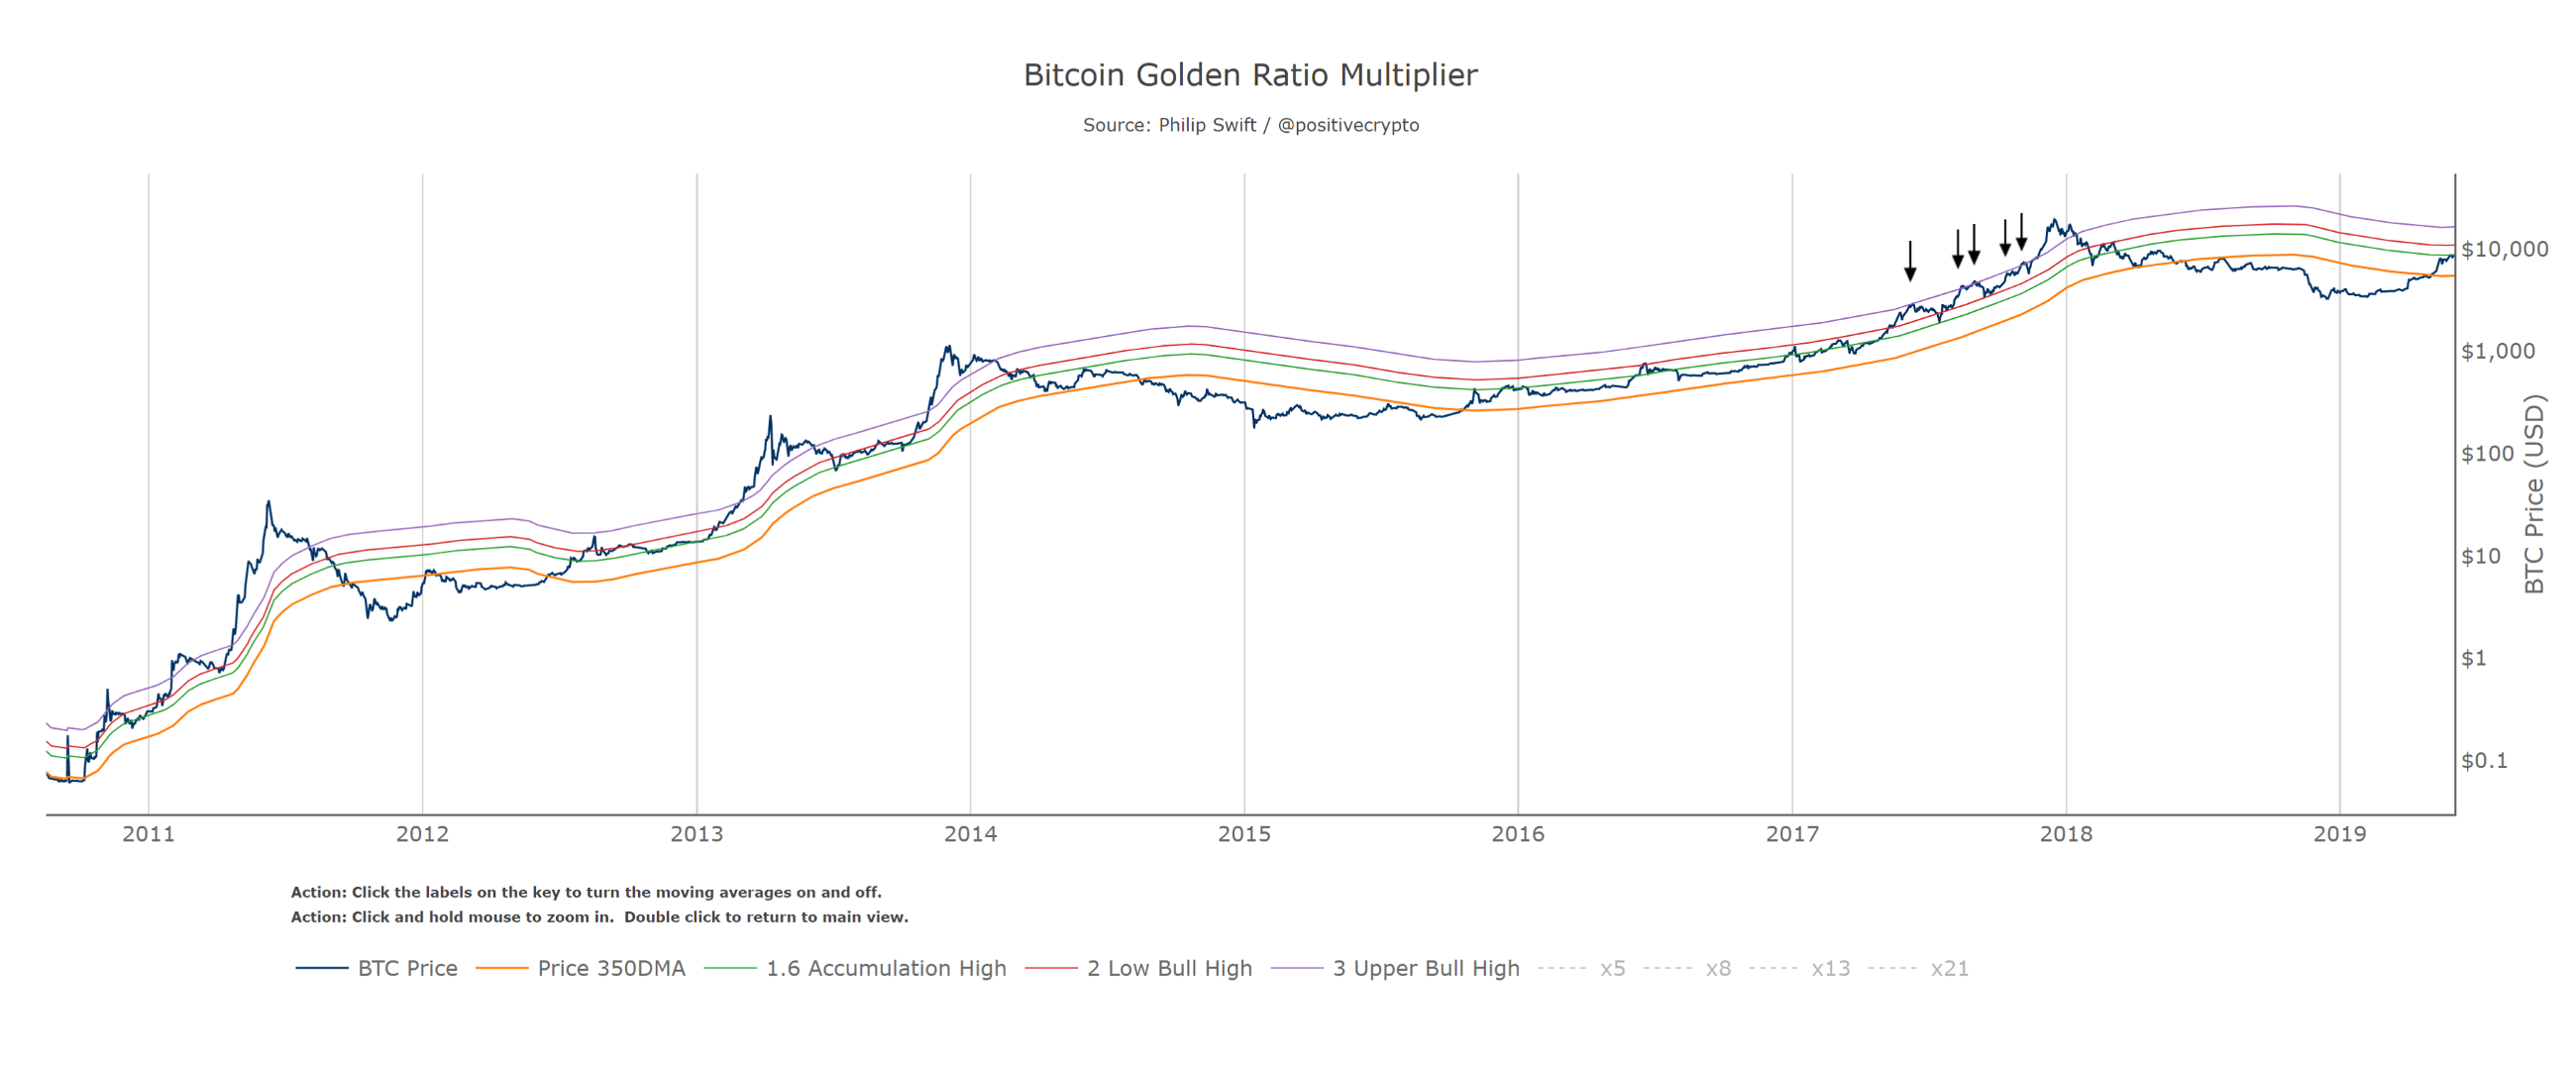
So we multiply the 350DMA by x2. Which is the red line in the chart below:
Again, the arrows highlight examples of where we see it act as a major level of support and resistance throughout Bitcoin’s history. As a trader or investor this, as well as the other multipliers, makes a potentially very useful short term take profit signal when price first reaches it.
The next number in the Fibonacci sequence is 3. So now we multiply the 350 day moving average by 3.
350DMA x 3 is the purple line in the chart below.
We see it acted as particularly strong resistance towards the upper stage of the 2017 bull market, with price unable to break above it on 5 separate occasions:
Using those three moving average lines (350DMA x 1.6, x2, x3) has allowed us to pick out almost every single intra-cycle price high in Bitcoin’s history.
The next numbers in the Fibonacci sequence are 5, 8, 13, and 21.
Remarkably, when we use these multiples of the 350 day moving average, they pick out each of Bitcoin’s market cycle tops going all the way back to the first price bubble in 2011. They are shown as dotted lines here:
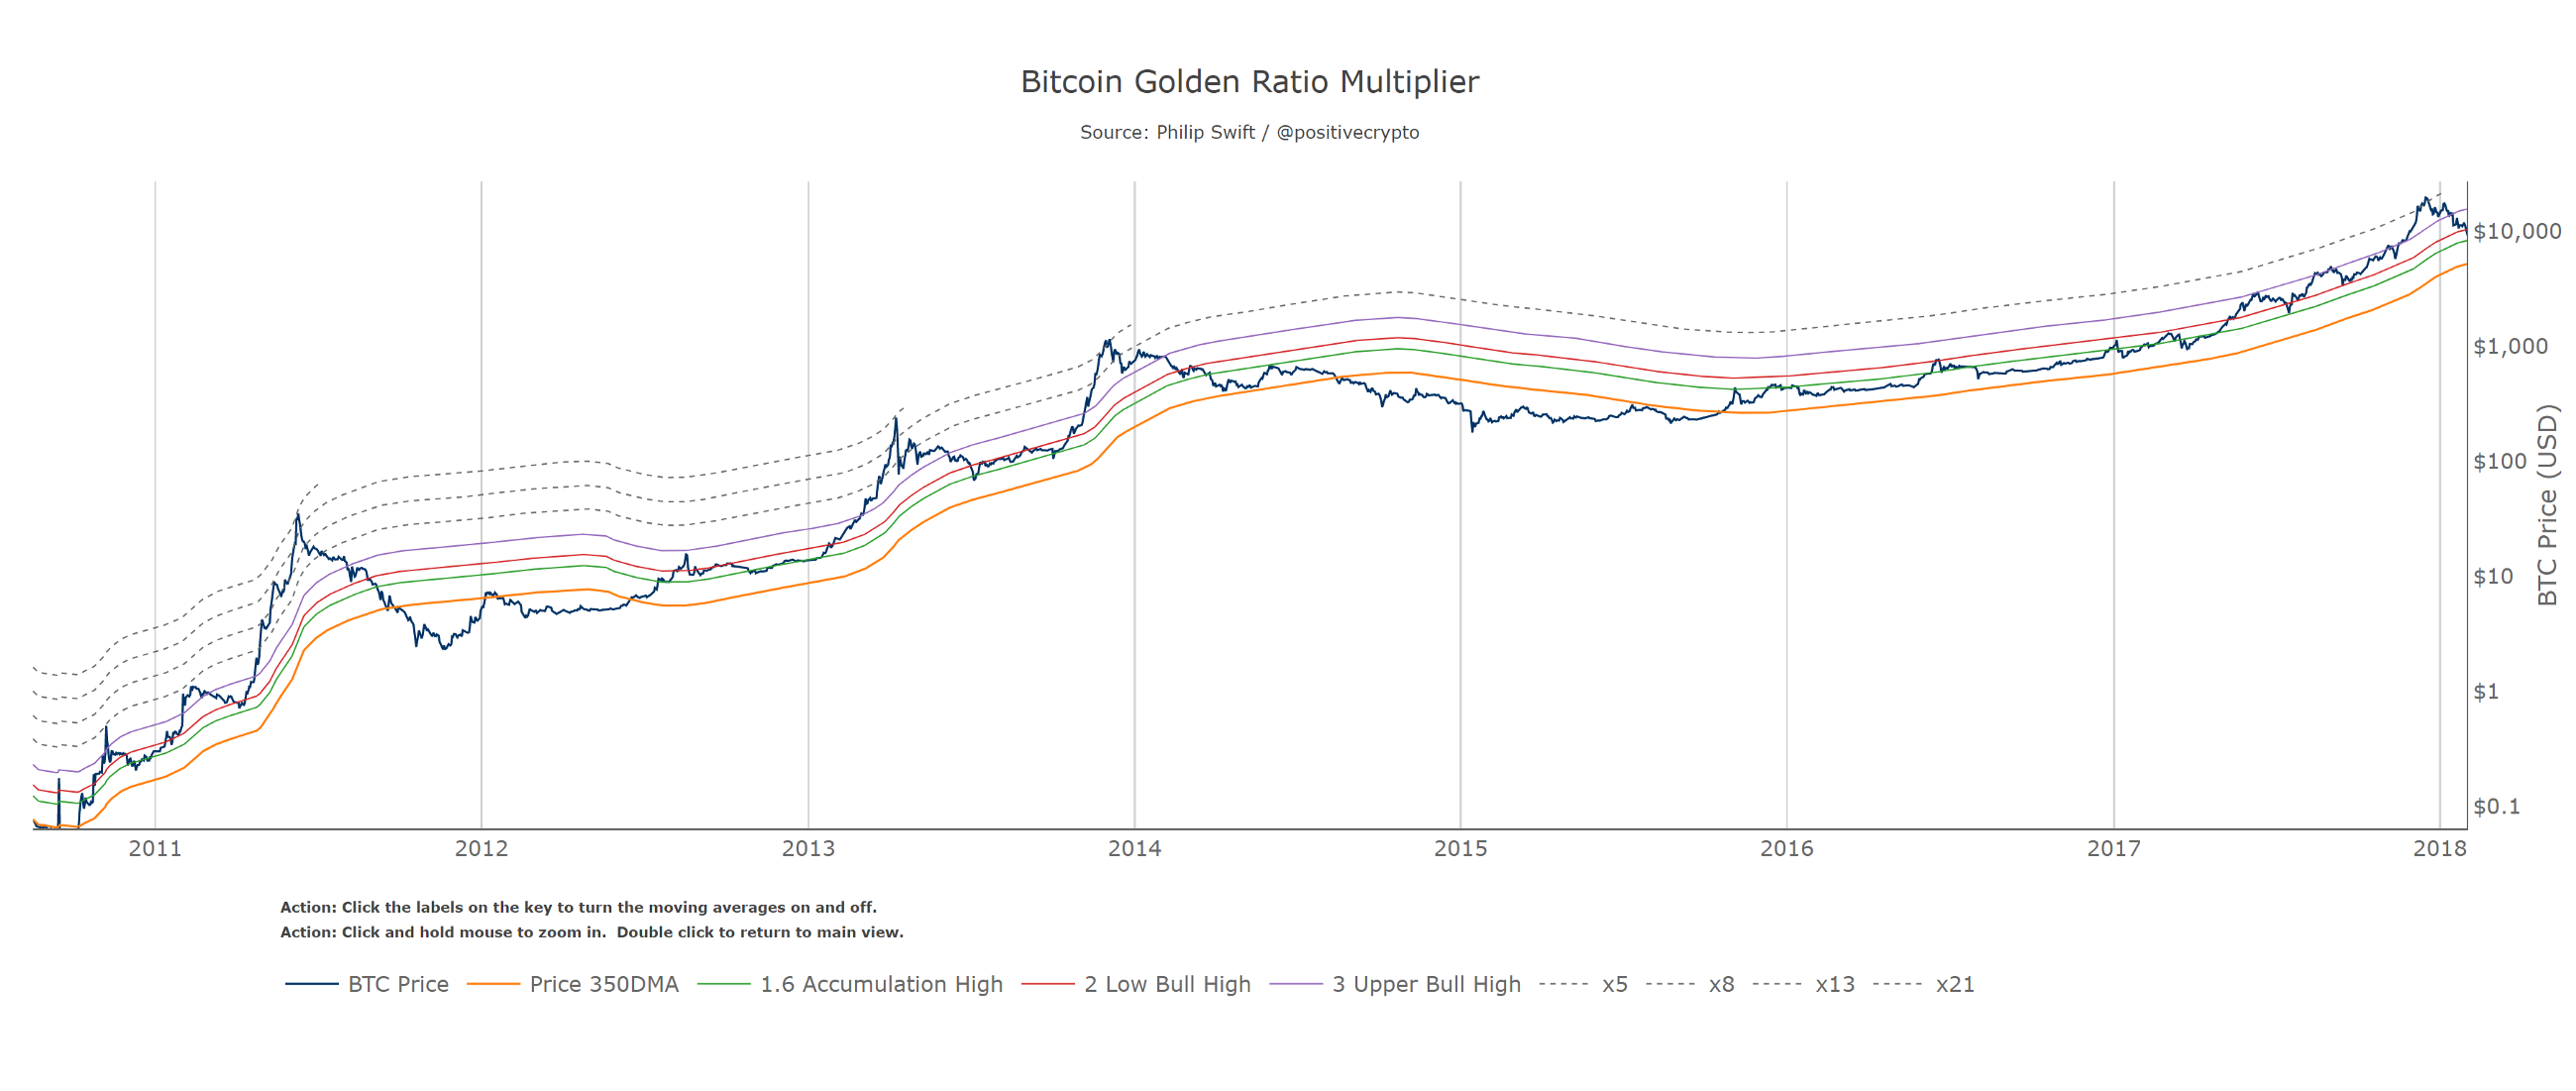
Bitcoin price action obeying Fibonacci multiples of the 350 day moving average
350DMA x21 = 2011 top
350DMA x13 = 2013 top
350DMA x 8 = 2014 top
350DMA x5 = 2018 top
Practical application
As with any indicator, the Golden Ratio Multiplier should not be used in isolation, but it does offer a risk management opportunity. Using the previous cycle as an example, if one had bought the breakout at the 350DMA and then taken profit the first time price reached the x1.6, the x2, and the x3, buying back lower each time, that would have been a very successful investment strategy. One could then have sold the top of the market as price touched the 350DMA x5.
If Bitcoin’s market cycle tops continue to follow this declining Fibonacci sequence, then the next market cycle top will be when price hits the 350DMA x3 (purple line).
Why does price obey these levels?
We know that Bitcoin goes through multi-year market cycles which are driven by over-optimism and over-pessimism. The 350DMA appears to be particularly relevant to those market cycles as to date it has been the axis that the cycles have rotated on.
Given that market psychology (of over-optimism and over-pessimism) is a major factor driving these market cycles, it is plausible that part of the reason why Fibonacci multiples of the 350DMA are so important is due to how herd mentality responds to price action:
In many cases, it is believed that humans subconsciously seek out the golden ratio. For example, traders aren’t psychologically comfortable with excessively long trends. Chart analysis has a lot in common with nature, where things that are based on the golden section are beautiful and shapely and things that don’t contain it look ugly and seem suspicious and unnatural. This helps to explain why, when the distance from the golden section becomes excessively long, the feeling of an improperly long trend arises.
Understanding Fibonacci Numbers. Dima Vonko, Investopedia, 2019
Whatever the reason, the tool highlights the cyclical nature of Bitcoin adoption and the flattening of its growth trajectory on a log scale.
Bonus: picking market cycle tops to within 3 days
Using the x2 multiple of the 350 day moving average along with the 111 day moving average provides us with a different market cycle indicator.
When the 350DMA x2 crosses below the 111DMA, Bitcoin price peaks in its market cycle. Over the past three market cycles, this has been accurate to within three days of Bitcoin price topping out:
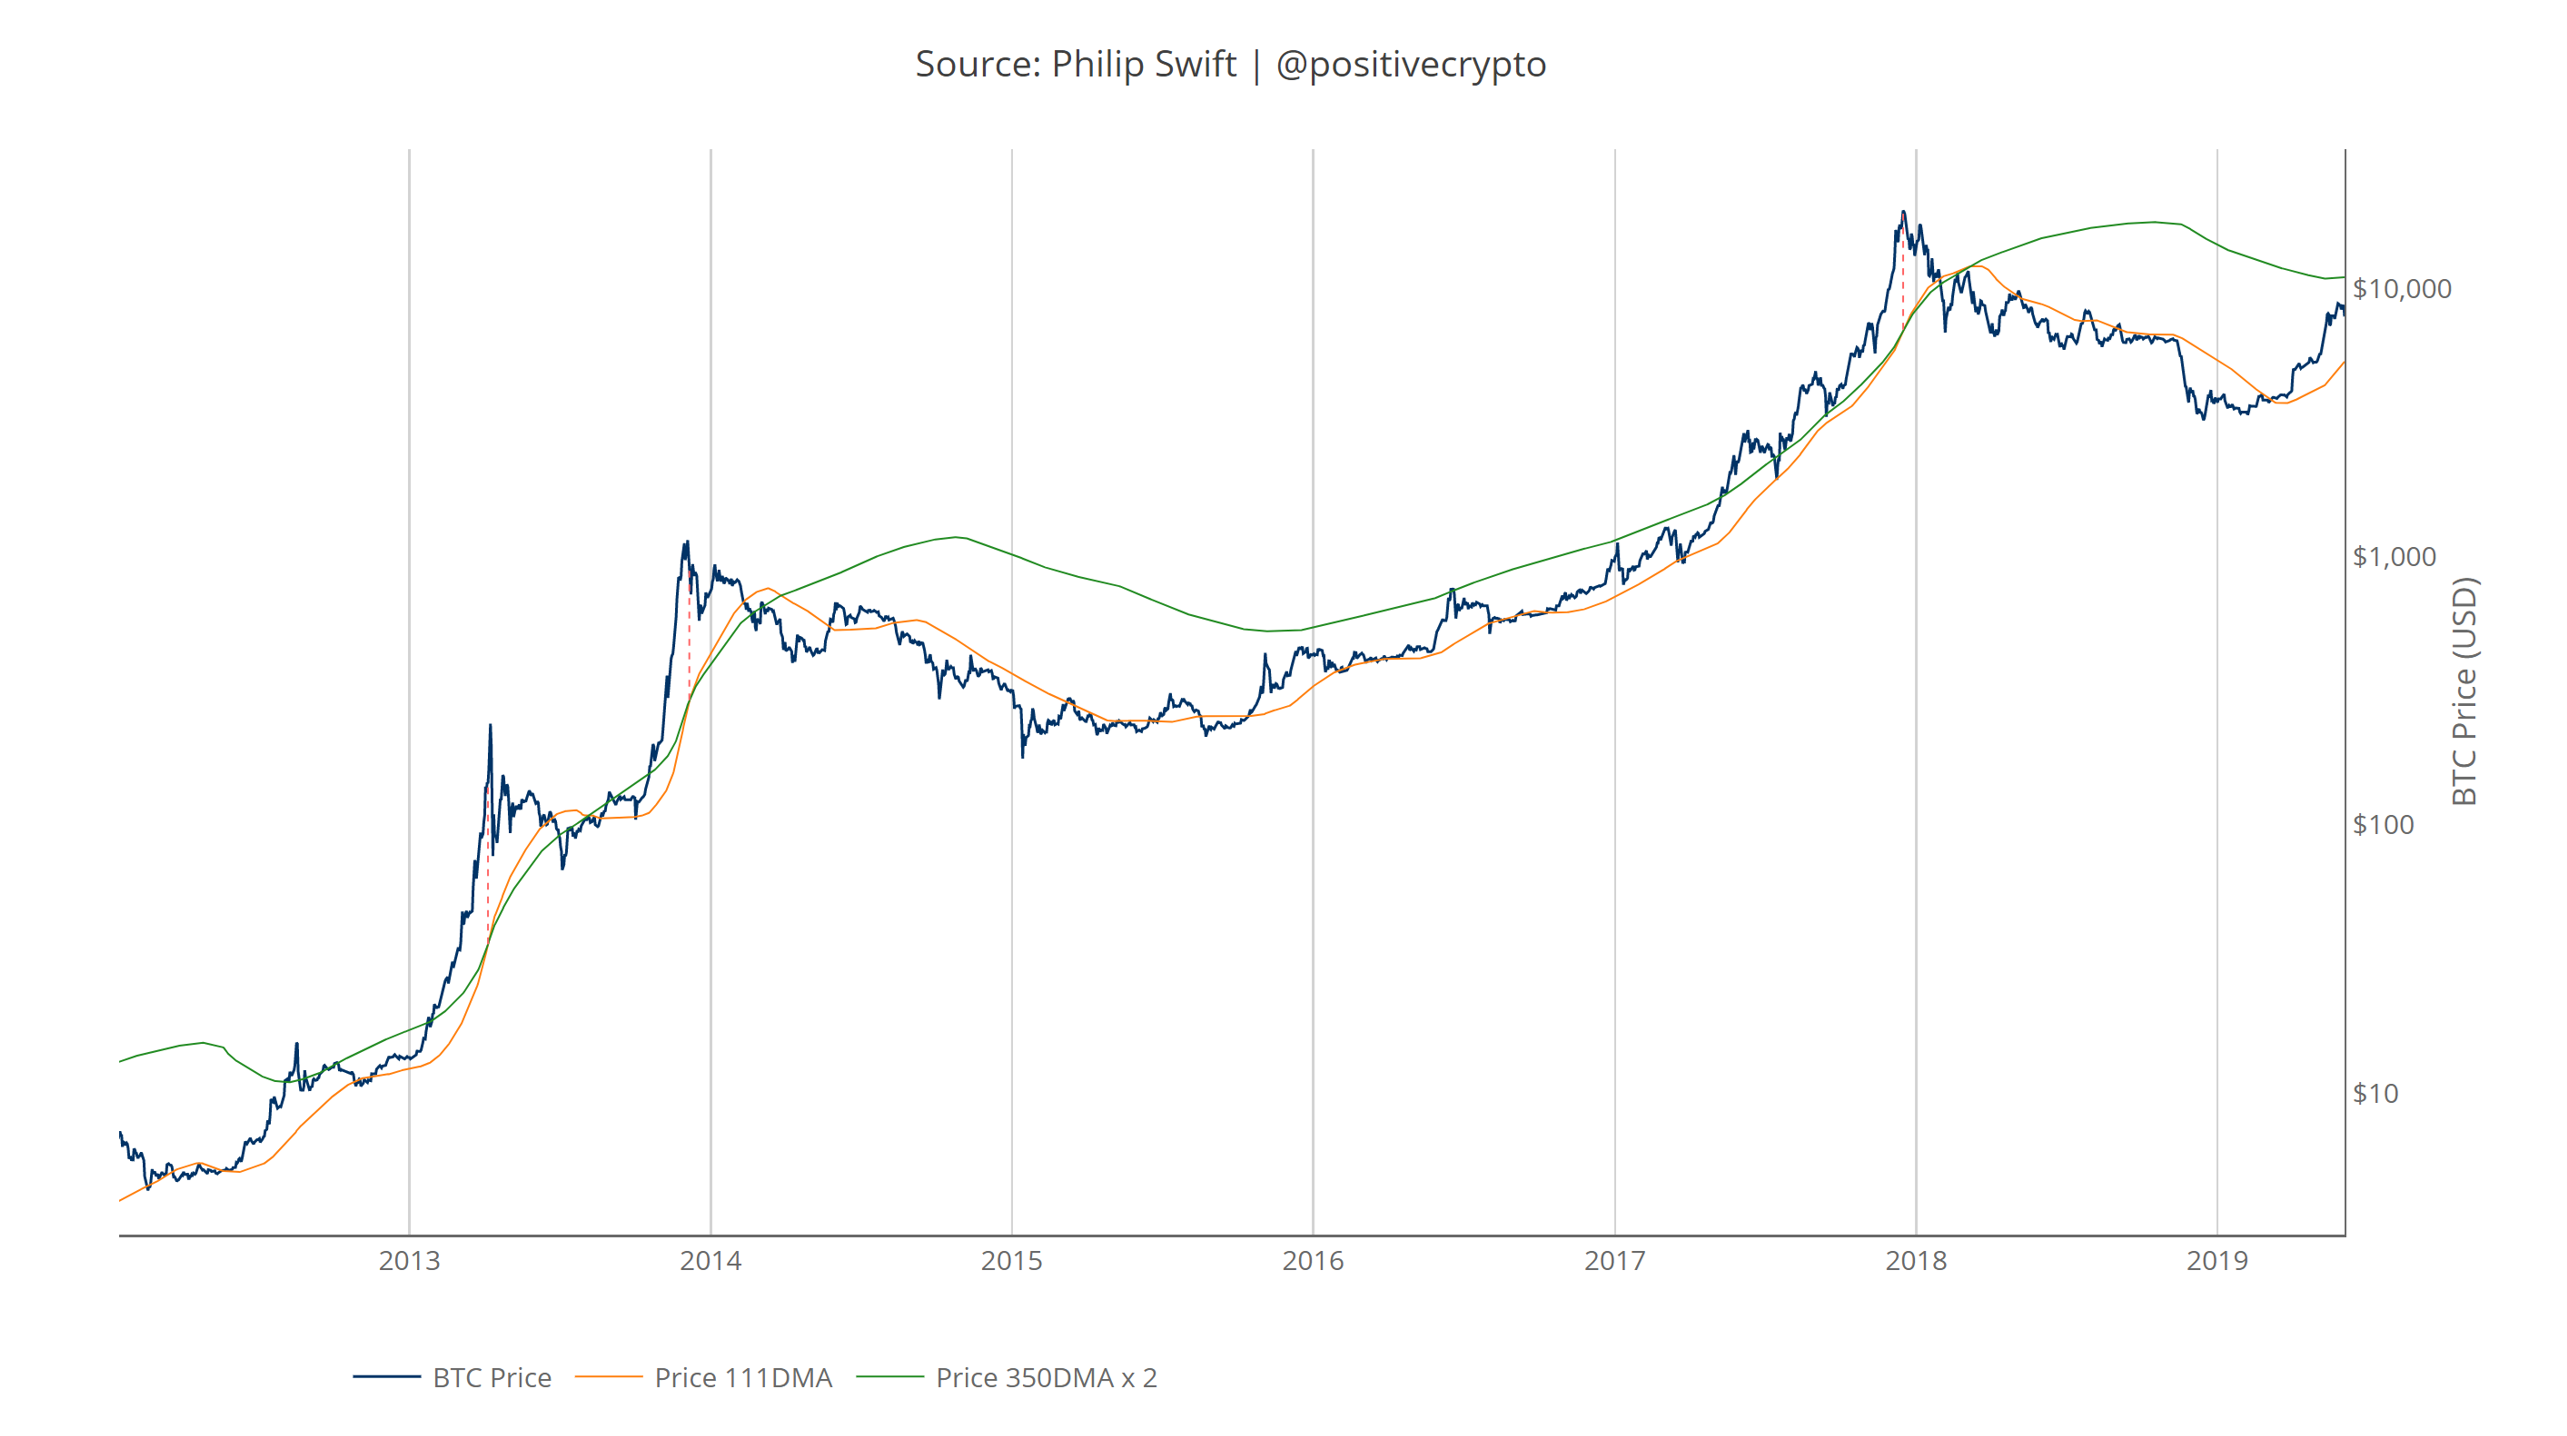
This will be something worth monitoring in the latter stages of the coming bull run.
It is also of interest to note what 350 / 111 equals:
350 / 111 = 3.153
Which is very close to Pi.
Pi = 3.142
It is, in fact, the closest we can get to Pi when dividing 350 by another whole number.
Conclusion
The Golden Ratio Multiplier will be a useful investment tool in this coming market cycle for identifying areas of take-profit as price approaches the multiplier levels of 350DMA x1.6, x2, and x3.
Assuming the Fibonacci sequence countdown continues to play out, the 350DMA x3 will signal the top of this coming market cycle.
The tool can also signal market tops when used alongside the 111DMA.
But arguably more powerful than these investment and trading benefits is the ability to demonstrate how Bitcoins adoption, and therefore our herd behaviour as humans, is following mathematical structures.
Via its price action, Bitcoin is offering us the opportunity to view free market adoption in real time, revealing how humans adopt at scale. Which is a beautifully humbling phenomenon to observe.
Thanks to Willy Woo for his assistance with the Golden Ratio chart layout aesthetic.
To use the live chart of the Golden Ratio Multiplier follow me on Twitter where there is a link to it in my bio. It is free to use and doesn’t require sharing any personal data. I’ll be sharing more tools via Twitter in the coming months.