Rethinking Metcalfe’s Law applications to cryptoasset valuation
Rethinking Metcalfe’s Law applications to cryptoasset valuation
Introducing Network Value to Metcalfe (NVM) ratio and using it to identify and predict price bubbles
By Dmitry Kalichkin
Posted May 21, 2018
This is the second article from our series on cryptoasset valuation techniques. The first article is Rethinking Network Value to Transactions (NVT) Ratio .
For cryptoasset investors the first quarter of 2018 has been drastically different from 2017. Following a truly remarkable (albeit, not 100% healthy) 60x appreciation in 2017, the crypto market has experienced a strong correction, falling 58.2% from an opening $612bn in total network value on January 1st, to $256bn at the end of Q1. In April, the markets have turned around and regained some of these Q1 losses. Following all this volatility, right now many investors are puzzled by the question as to whether this is the end of price corrections, or just a temporary reprieve.
To answer this question Cryptolab Capital uses a data-driven approach to cryptoasset valuations and looks at the fundamental foundations of asset prices. In our February article Rethinking Network Value to Transactions (NVT) Ratio we shared one of the quantitaive metrics that we use. Today I’m excited to tell you about how we use Metcalfe’s Law for cryptoasset valuation and investment decisions, and to introduce the Network Value to Metcalfe ratio (NVM).
Summary
Our goal was to estimate whether current Bitcoin price is supported by activity on the network. To do this we have built robust upper and lower bounds for Bitcoin Network Value, based on a number of Daily Active Addresses (DAA), using different variations of Metcalfe’s Law. Using these bounds, we have defined bottom-up valuation of the Bitcoin network as a function of DAA.

When we compared this valuation with actual market Network Value across different time periods, we have found that historically overvaluation can be predicted by Network Value to Metcalfe (NVM) ratio:

We analyzed current (as of early May 2018) Bitcoin price using this NVM ratio, and came to the conclusion that despite significant correction in Q1 2018, there might be another bubble (and following correction) on the horizon.

Having said this, while we see a risk of correction, we stay bullish on Bitcoin price in the long run.
Metcalfe’s Law: how it all began
Cryptoassets are networks of users connected in digital space. Users can interact with each other by exchanging information and engaging in transactions. Due to the fact that these networks are digital, always online, and published on the the blockchain, network usage data is more readily available than for other types of networks (telephone, fax, messengers, and social media). Transaction data availability combined with public crypto markets create a unique opportunity to analyze and value these networks in real time.
Nearly four decades ago, Xerox Palo Alto Research Center (PARC) employee Robert Metcalfe proposed arelationship between the value of a network and its size(Metcalfe, 2013). He stated that the value of the network is proportional to the square of the network nodes (users). This relationship is based on the so-called “network effect”: a positive effect described in economics and business that an additional user of a product or service increases its value to others. The original Metcalfe’s Law has the following form:

The logic behind this formula is the following: the number of unique connections in a network with n nodes can be expressed as n(n − 1)/2, which is proportional to n² asymptotically.
Over time, some variations of this law were proposed. For example, Andrew Odlyzko et al. noticed that Metcalfe’s Law estimates a number of potential_connections between users of the network, while, in fact, there are certain limitationsto how many _useful connections one user can have. He proposed to use n * log n instead of n² for network value estimation for large n. There were multiple other modifications to the original law. Some researchers have successfully applied the law to describe Facebook and Tencent user growth and financial metrics.
Usage in cryptoasset valuation
Over the past year, a lot of research has been done on the topic of valuing cryptoassets using Metcalfe’s Law. Cryptolab Capital research on Metcalfe’s Law was initially inspired by Thomas Lee of Fundstrat, who has stated back in November 2017 that 94% of Bitcoin price movement can be explained by Metcalfe’s Law.
We decided to dig deeper and have found an earlier paper on the topicpublished by Ken Alabiin June 2017. In all these articles the number of network users is usually approximated by the number of Daily Active Addresses (DAA). For internet companies with strong network effects, the analogous Daily Active Users (DAU) indicator is one of the most important performance and valuation metrics.
One of the recent articles on the topic by the Clearblocks team explored in detail how well different versions of Metcalfe’s Law describe Bitcoin price. Their research revealed 3 candidates for the title of “the most predictive model”:
- Original Metcalfe’s Law: NV ~ n²
- Generalized Metcalfe’s Law: NV ~ n^1.5
- Odlyzko Law (also called Zipf’s Law): NV ~ n • log n
They calculated Pearson correlations for all three of these laws over the period between 2010 and 2018, and based on this analysis chose law #2. They then used it to define Price-to-Metcalfe Ratio by dividing actual Network Value by the one predicted by the law:

where n is Daily Active Addresses (DAA), and 30 day MA is 30 day moving average.
There is an issue here, however: it is very hard to objectively choose between these three laws,and the Clearblocks team admits it in the article themselves:
All formulas show near perfect correlation with BTC’s USD price, particularly on a natural log scale. In any other field, such a correlation would be considered witchcraft… The differences in correlations are so small they can effectively be considered equal
At the same time the value of the ratio (and hence the results of PMR analysis) depends greatly on which law you choose for denominator. Different values in denominator give you contradicting results when it comes to predicting December 2017 bubble and to describing current BTC price.
Different laws — contradicting results
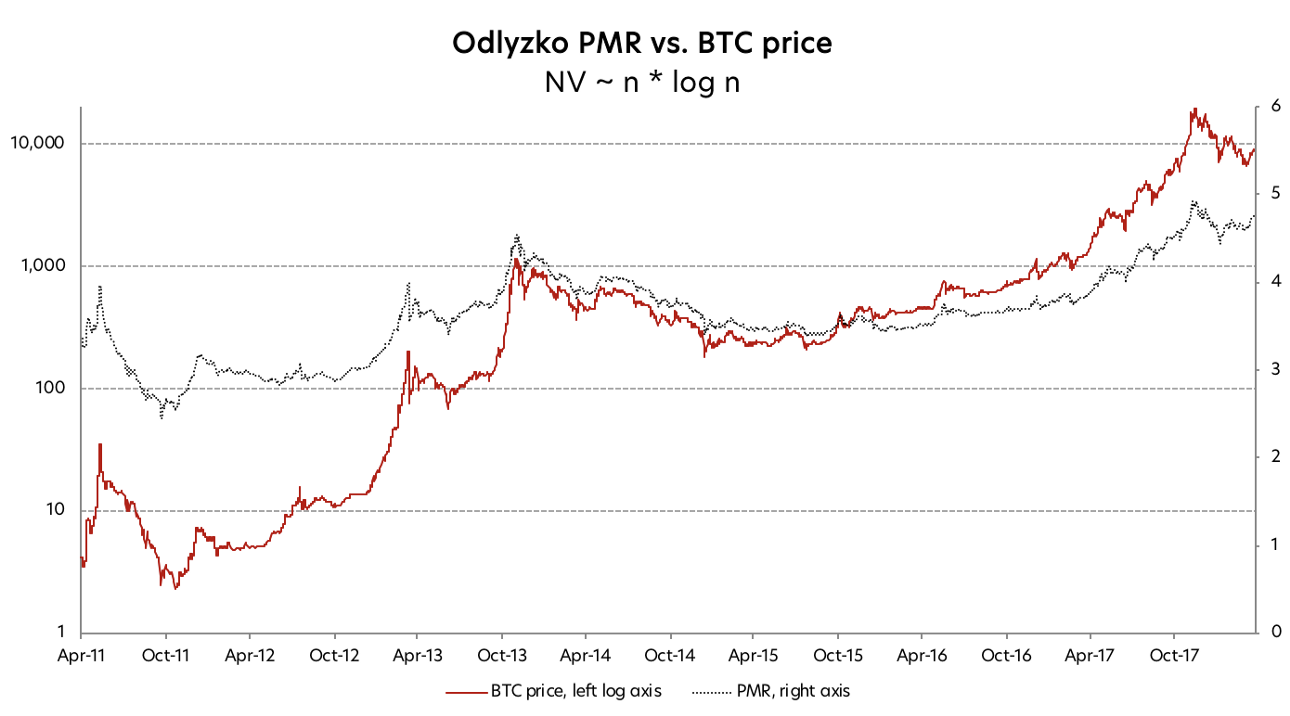
If you define the PMR denominator using Odlyzko Law (NV ~ n log n), you will get the following formula:

where n is DAA. If you then plot the resulting Odlyzko PMR against Bitcoin price, you will get the graph below. Based on this graph, PMR is at its all-time high level of around 5, and we are still in the middle of the worst bubble in Bitcoin history. Corrections in Q1 2018 didn’t help much — even at around $6k in February 2018 Bitcoin was still presumably significantly overvalued according to this analysis.
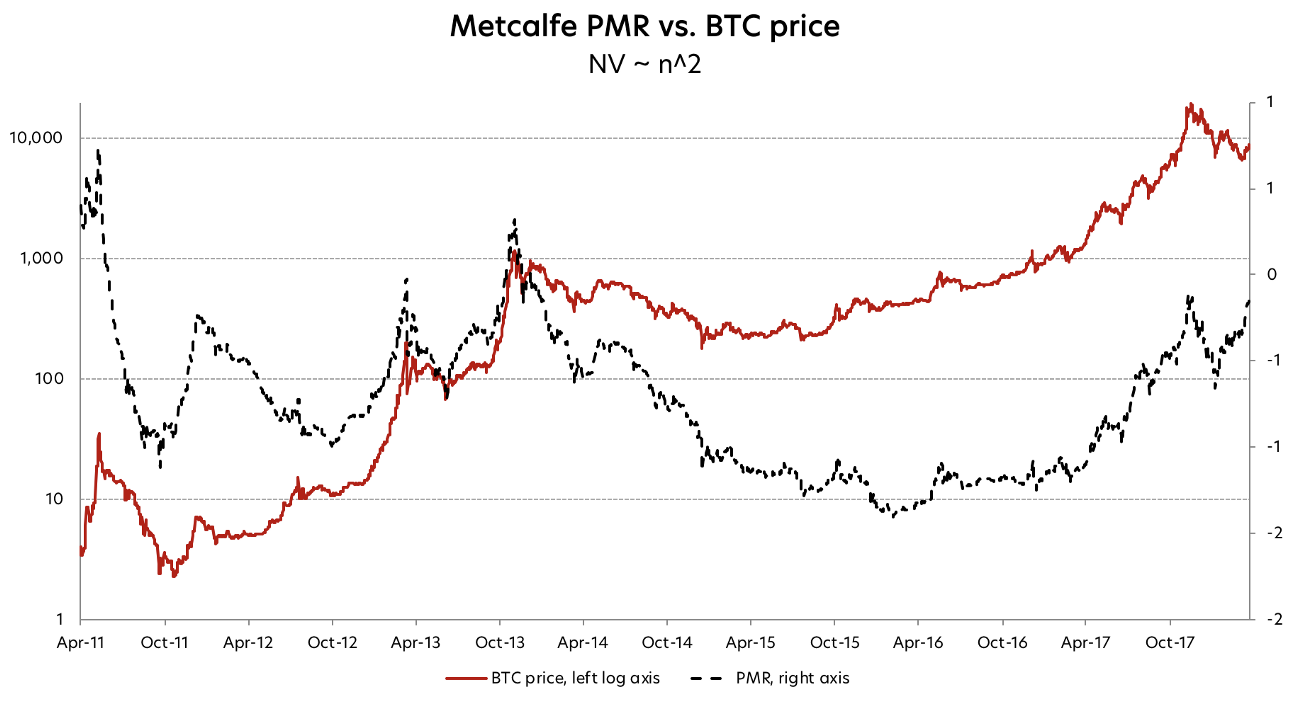
Now let’s use the original Metcalfe’s Law as the PMR denominator giving the formula below:

If you now plot this PMR against BTC price, you will get very different chart. By closely examining this chart you can see that current PMR value is around 0, which is nowhere close to the bubbles of 2011 and 2013. And at the lowest point of correction in Q1 2018 PMR was around -0.5. Last time it was on the same level in October 2014 and August 2017. As we now know, in both of these cases it was a good time to buy BTC.
As we said above, PMR analysis gives contradicting results for December 2017 and for May 2018, depending on which law you choose for the PMR denominator.But it is also impossible to choose between the laws based on their all-time correlations between the actual and predicted Network Values.
Here we asked ourselves 2 questions:
- Can we come up with a better heuristic for choosing the best law?
- If not, is there a way to somehow use both of these laws instead of choosing one?
Unfortunately, the answer to the first question is “no, we can’t”. Those of you interested in the algebra and statistics behind this conclusion can find detailed explanation here.
Luckily, the answer to the second one is yes. We used both Metcalfe’s Law and Odlyzko Law to define extremely robust upper and lower bounds for Network Value, and derived a ratio that is indicative of Bitcoin overvaluation.
Two laws are better than one
According to the logic behind the Metcalfe’s Law, n² is a number of potential_connections between users of the network, and in reality there are limitationstonumber of _useful connections one user can have. So Metcalfe’s Law (Network Value ~ n²) probably overestimates network value, which is why it’s logical to use it as an upper boundfor valuation of Bitcoin network. At the same time we can use Odlyzko Law (Network Value ~ n • log n) as alower bound:
 Upper bound based on Metcalfe’s
 Law Lower bound based on Odlyzko Law
Constants a and b for each bound were chosen empirically to have the narrowest corridor possible that still covers all the movements of Network Value. To make sure we didn’t overfit and didn’t use future information, we used only first 2 years of data to select a’s and b’s. After fixing the constants based on this “training” set, we checked that the relationship holds well for the rest of the data (“validation set”).
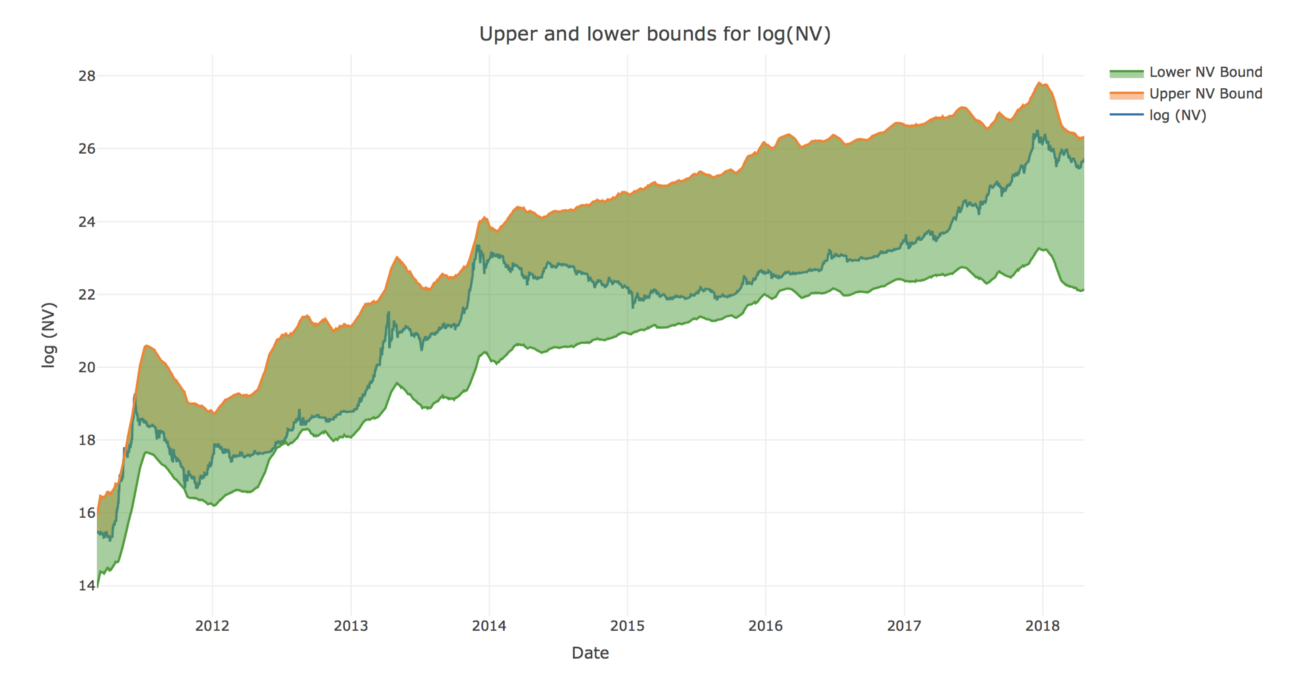
If we now plot the Network Value and respective bounds derived from Metcalfe and Odlyzko Laws, we can see that NV robustly stays within these bounds all time except a few days back in 2011 (and even then it barely crosses the border).
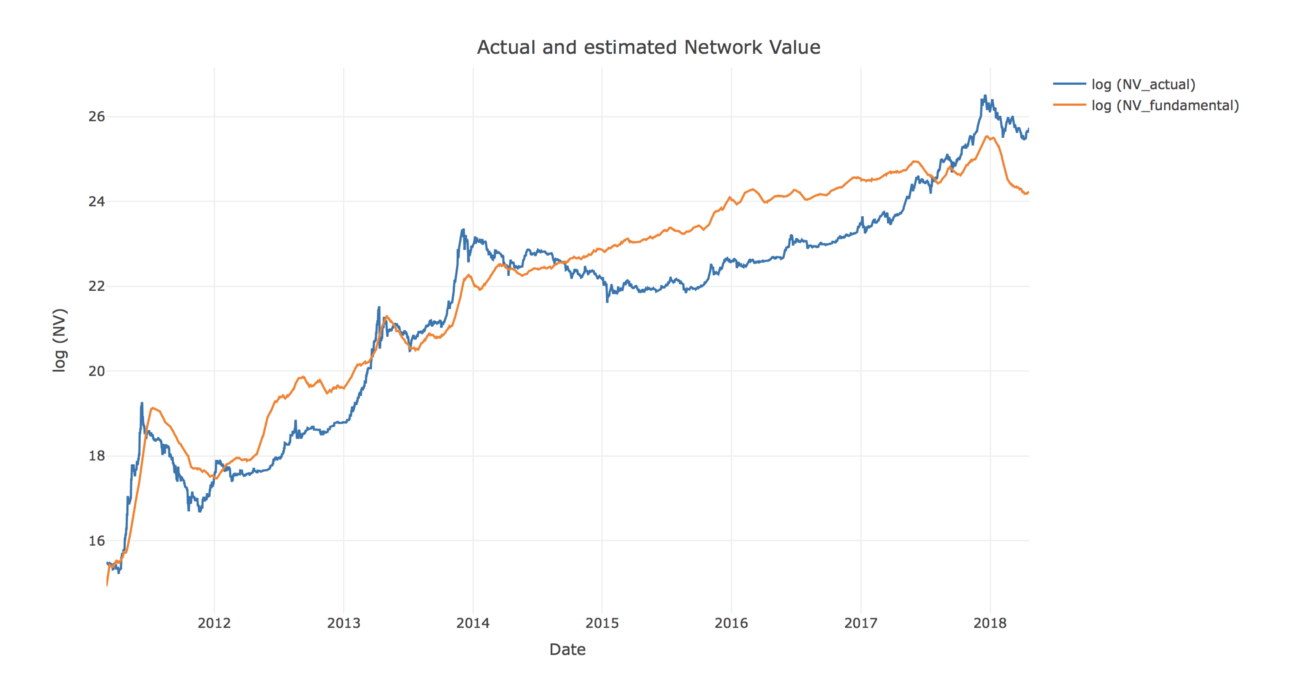
Now that we have robust upper and lower bounds, we can, with confidence, use the halfsum of upper and lower bounds as a bottom-up valuation of the Bitcoin network as a function of DAA:

Below is a chart of actual and Metcalfe-estimated fundamental Network Values. Visually, this relationship is staggering.
Moreover, on the previous chart with the bounds we can clearly see that every time Network Value has approached its upper bound, there was a correction that followed. And conversely, every instance when Bitcoin Network Value was near the lower border, it was a good time to invest.
Using our newly defined Metcalfe network valuation, we can formalize this logic into a new, refined, indicator that we called Network Value to Metcalfe ratio (NVM):

One last transformation: let’s normalize NVM so that it always stays between -1 and 1 no matter how wide the corridor between the bounds is:

NVM describes Network Value position relative to the upper and lower bounds, and thus quantifies any overvaluation or undervaluation.Normalized NVM of -1 means that Network Value is near the lower bound, and a value of 1 signifies that it has reached the upper bound.
Below is the chart of normalized NVM and Bitcoin Network Value. As can be seen on the chart, high NVM has successfully predicted corrections in 2011, 2012, 2013, 2014, and late 2017.
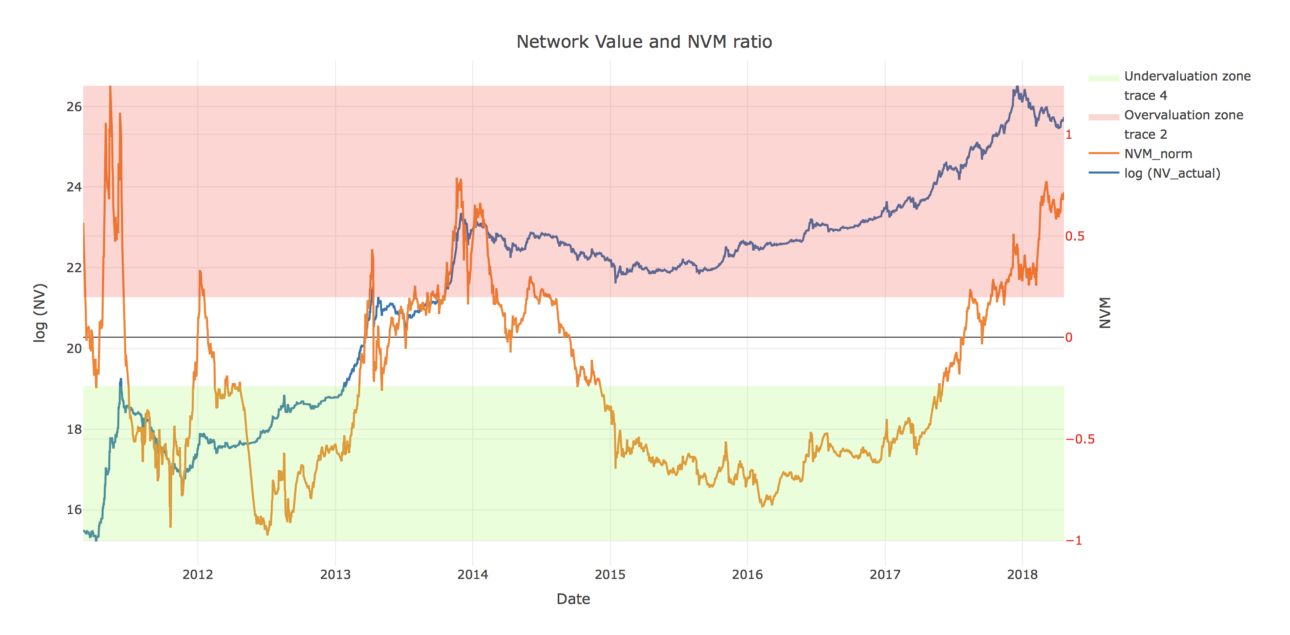
So, are we in the bubble?
BTC Network Value is close to the upper bound, and NVM is around 0.75. Current NVM value is even higher than it was in December 2017, and is at the same level it was at the height of the 2014 bubble.
High NVM suggests that Bitcoin is overvalued at the moment, compared to the Metcalfe NV estimation derived from DAA data. According to our model, Metcalfe network valuation is around $33bn, while the actual NV as of May 6th is $162bn. If we take this result at face value, this means that BTC is ~ 5x overvalued, compared to a Metcalfe price of about $2,000. But let’s dive one level deeper, and try to analyze why NVM is at this level right now.
Let’s look for analogies in traditional finance. High PE ratio is usually considered to be a signal of company overvaluation. But it can also be explained by unusually low recent earnings caused by business seasonality or other factors. If low earnings are expected to increase shortly, high PE is not necessarily bad.
Let’s try to apply similar logic to NVM. Based on the historic NVM performance, from here it can go one of two ways:
- NVM will decrease because of lower numerator. BTC price correction will bring Network Value closer to(or even below) the Metcalfe-derived valuation. This will be similar to the pattern we saw in early 2014.
- NVM will decrease because of higher denominator. Daily Active Addresses will grow, thus increasing the Metcalfe valuation and bringing it closer to actual Network Value. A similar pattern can be seen in early 201
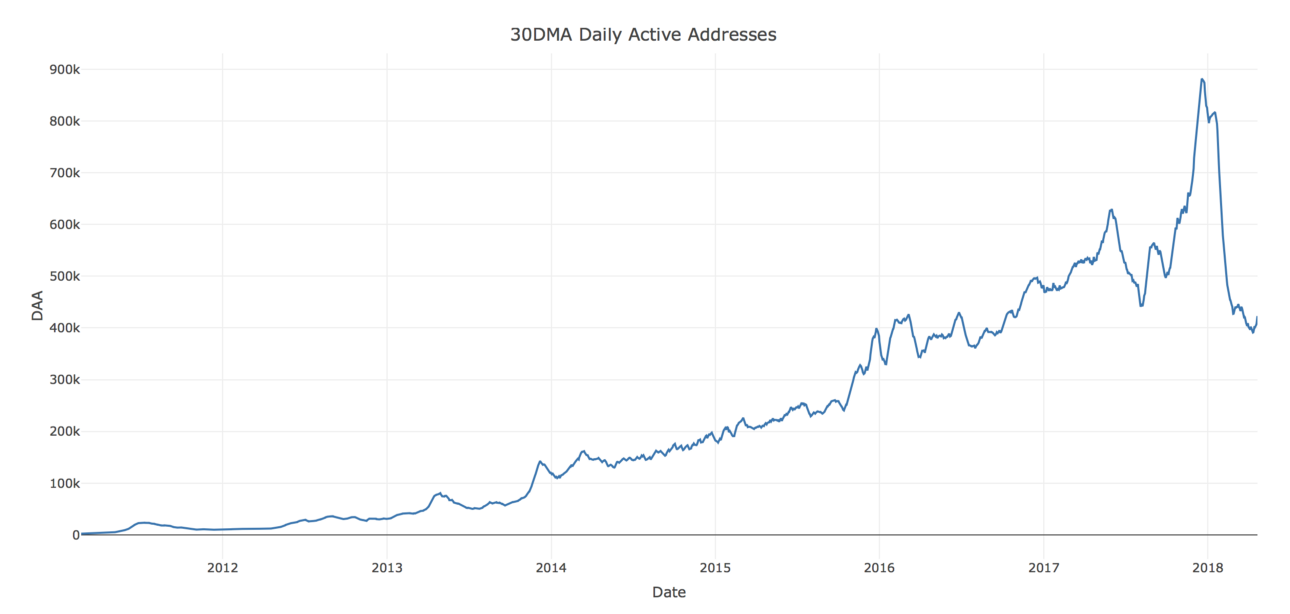
Let’s have a look at number of Daily Active Addresses. The chart below shows there was a significant drop in DAA in Q1 2018.
Let’s again compare the current May 2018 situation with December 2017:
- As we noticed before, NVM was high in both cases
- But in December 2017 DAA was unusually high — well above the long-term trend. Given an expected drop in DAA back to the trendline, price correction was the only way to bring Network Value close to fundamental Metcalfe valuation.
- On the contrary, in May 2018 the Daily Active Addresses figure is unusually low
- If DAA to bounces back up to the trendline, it will increase fundamental Bitcoin valuation
Overall, while the current price level is healthier than in December 2017, it is still not 100% supported by fundamentals.Investors should closely monitor the DAA dynamic relative to market Network Value. If Bitcoin price continues growing further without advancing growth of DAA, there might be another bubble (and another correction) on the horizon.
Acknowledgements
There were a few people who have contributed to this research, and inspired us to do it in the first place:
- Thomas Lee for the original inspiration to look into Metcalfe’s Law applications to cryptoassets
- Haseeb Quereshi,Ivan Bogatyy, and Chris Burniske for feedback on the article
- Professor Susan Athey from Stanford and Professor Christian Catalinifrom MIT Cryptoeconomics Lab for being great mental sparring partners on everything crypto
- Special thanks goes to all the Cryptolab Capital team, and especially to our analyst Roman Skoromnyi who did a lot of data heavy-lifting during this research
Disclaimer: none of the statements in the article should be considered investment advice. Due to the various risks and uncertainties, actual performance of the assets may differ materially from that reflected or contemplated in forward-looking statements.