Dissecting Bitcoin’s Unrealised On–Chain Profit/Loss
| Crypto Words has moved! The project has migrated to a new domain. All future development will be at WORDS. | Go to WORDS |
Dissecting Bitcoin’s Unrealised On–Chain Profit/Loss
Introducing a New Set of Metrics to Help Time Bitcoin Market Cycles
By Rafael Schultze-Kraft
Posted November 13, 2019
Understanding the state of the Bitcoin blockchain with respect to the price at which BTC is being valued by the market is indispensable for any investor in this new asset.
In fact, Bitcoin on–chain data has been used in conjunction with off–chain market data in order to create metrics and indicators that help investors gain fundamental insights into the current state of the market, understand investor sentiment, or model the value of Bitcoin.
Popular examples are MVRV and SOPR.
These metrics have in common that they make use of Bitcoin’s underlying UTXO structure by comparing the value of Bitcoin at two different points in time: The current price and the price at the time a UTXO (bitcoin) was created (last moved), i.e. the realised price.
Here, we make use of the same underlying concept in order to answer a fundamental question:
If all bitcoins were sold today, how much would investors stand to gain or lose?
Or to put it differently: How much of Bitcoin’s circulating supply is at any given point in time in profit or loss — and to what extent?
The ability to access this information is important to investors with regard to Bitcoin’s primary narrative: to act as a digital, permissionless, censorship-resistant Store of Value (SoV).
To answer these questions, we take three different approaches and define new sets of metrics — each adding an additional level of detail:
1. The number of current UTXOs that are in profit/loss
A UTXO is in profit (loss) if the current price is higher (lower) than the price at the time the UTXO was created.
2. The current supply of Bitcoin that is in profit/loss
A bitcoin is in profit (loss) if the current price is higher (lower) than the price at the time the bitcoin last moved.
3. The unrealised profit/loss of the current Bitcoin supply
The profit (loss) of a bitcoin is calculated by taking the difference between the current price and the price at the time the bitcoin last moved.
Let’s dig in.
Number of UTXOs in Profit/Loss
The number of UTXOs in profit/loss is computed in a straight-forward manner: We simply count all existing UTXOs whose price at creation time was lower or higher than the current price, respectively.
Figure 1 below shows the absolute amount of UTXOs in profit/loss at any given point in time.
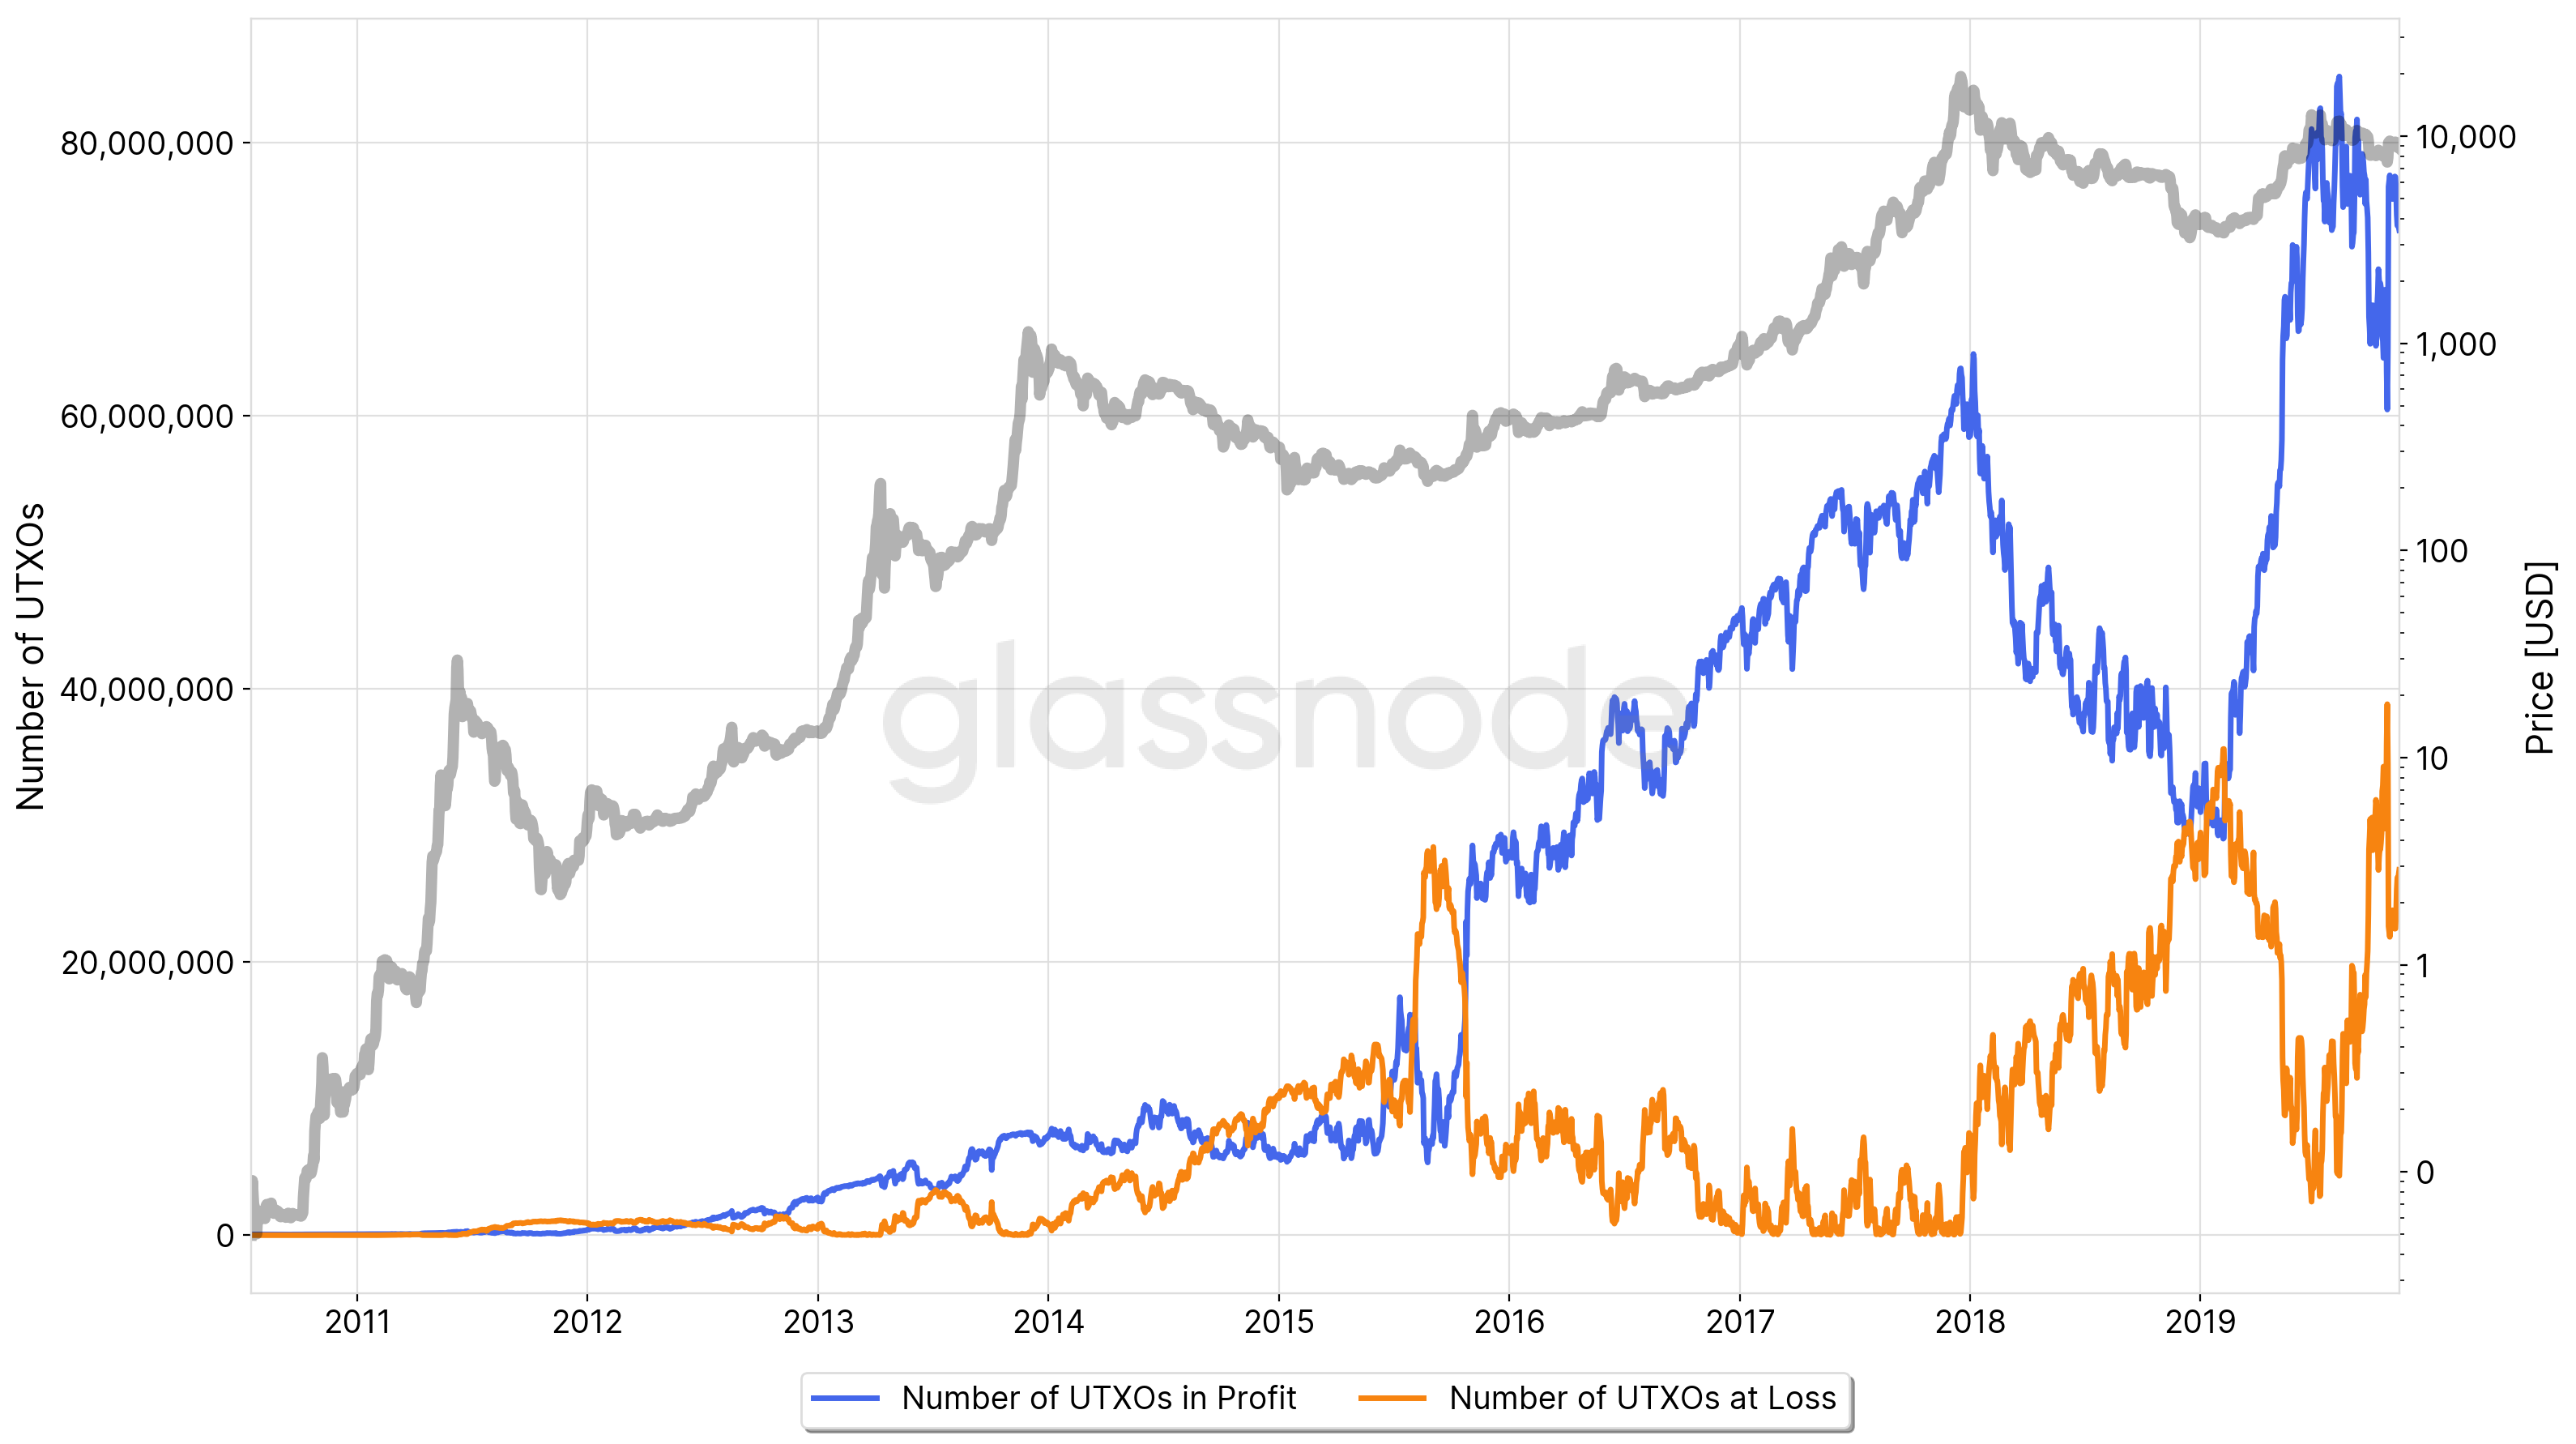 Figure 1 — Number of UTXOs in Profit and Loss
In order to account for the increasing number of UTXOs over time, we normalise these time series by the size of the UTXO set and obtain the relative number of UTXOs in profit/loss, i.e. the percentage.
Figure 2 below represents the 50d MA of the relative UTXO counts in profit. Note that when this metric approaches 100%, it has historically been a good indicator for global market tops.
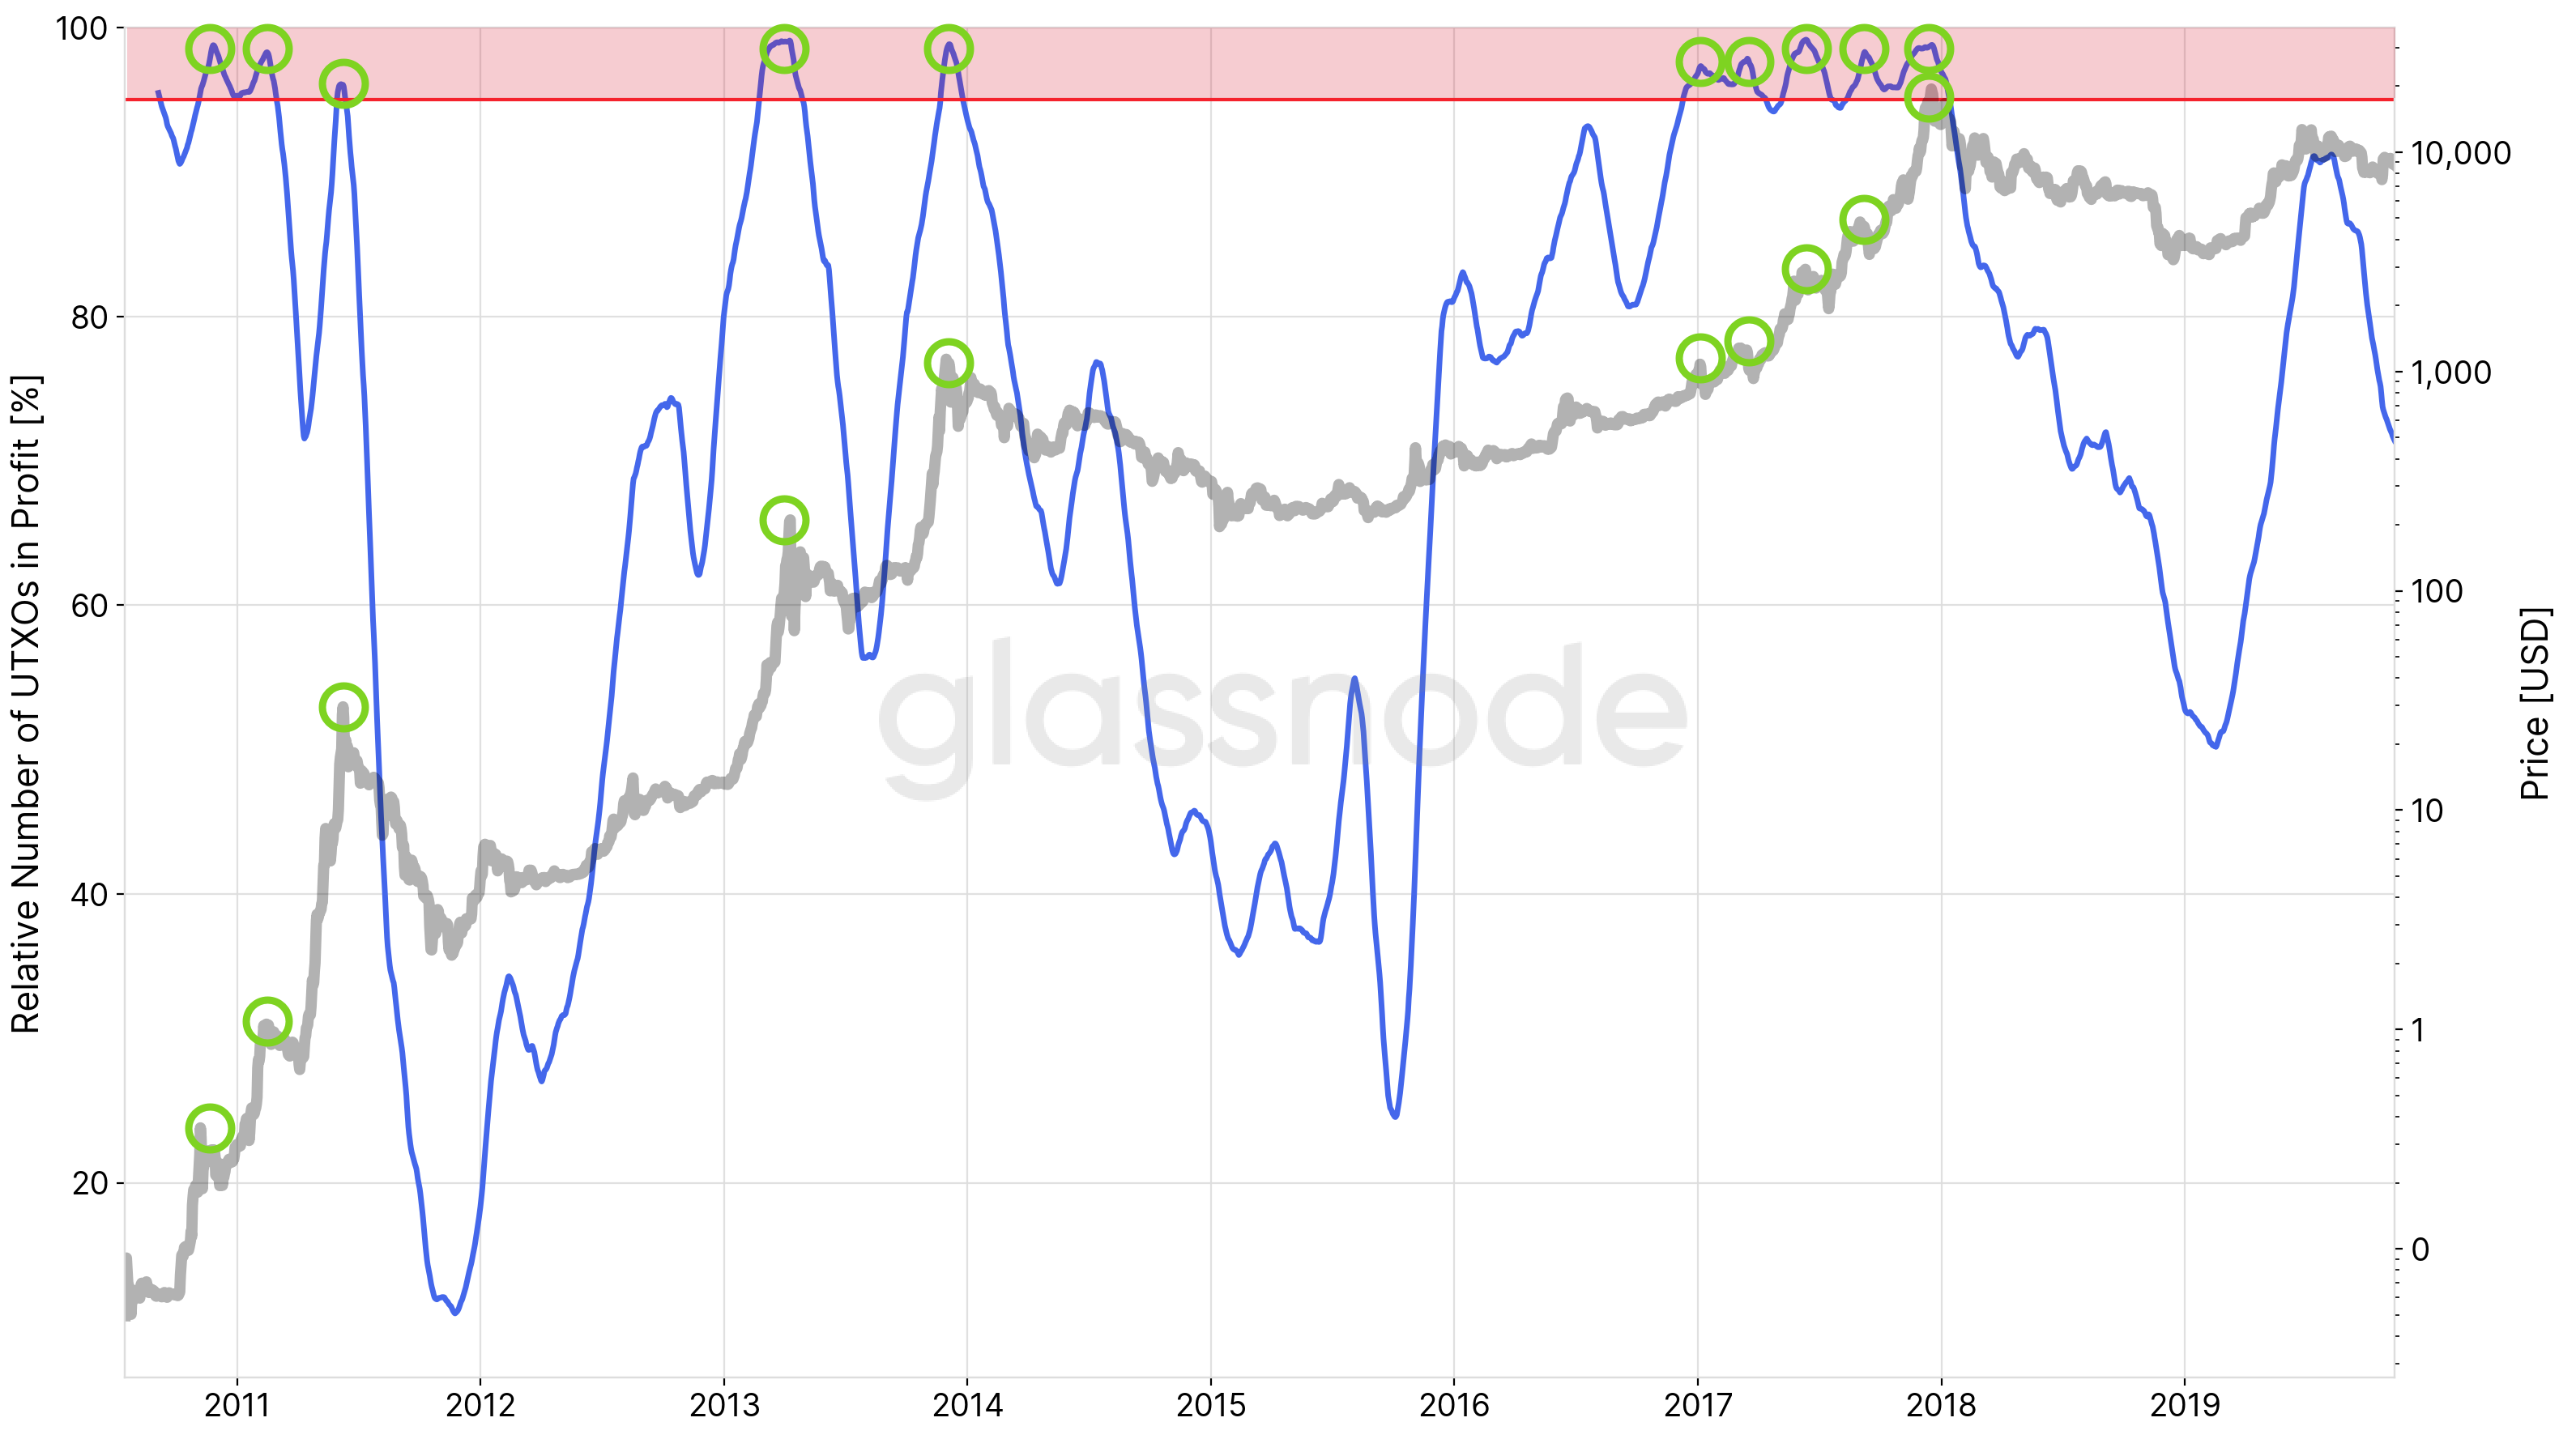 Figure 2 — Relative Number of UTXOs in Profit, 50d Moving Average
The bull run of 2017, however, shows a distinct behaviour with a sustained period of profitable UTXOs above 95% – a clear indication of the remarkable nature of the bull run that year. Throughout those months, the metric can be used to help identify short-term cycles and as a clear indicator to stay highly alerted throughout the mania of such periods.
Note that the relative number of UTXOs in profit approaches 100% every time a previous ATH price is broken – this is self-evident as it becomes nearly impossible to be in losses once a new ATH is surpassed. Therefore, we applied the simple 50d MA, which we have found to fit historic data optimally and which creates a signal that serves to indicate global/local Bitcoin cycle tops as shown above.
Live implementations of UTXOs in Profit/Loss metrics are available in Glassnode Studio:
Circulating Supply in Profit/Loss
A similar but even more informative metric is the number of circulating bitcoins that are in profit or loss. Instead of counting UTXOs, we now consider their bitcoin value (i.e. individual bitcoins) and sum up those whose price at the time they last moved was lower or higher than the current price, respectively.
The stacked graph below shows the supply of bitcoins in profit/loss at any given point in time.
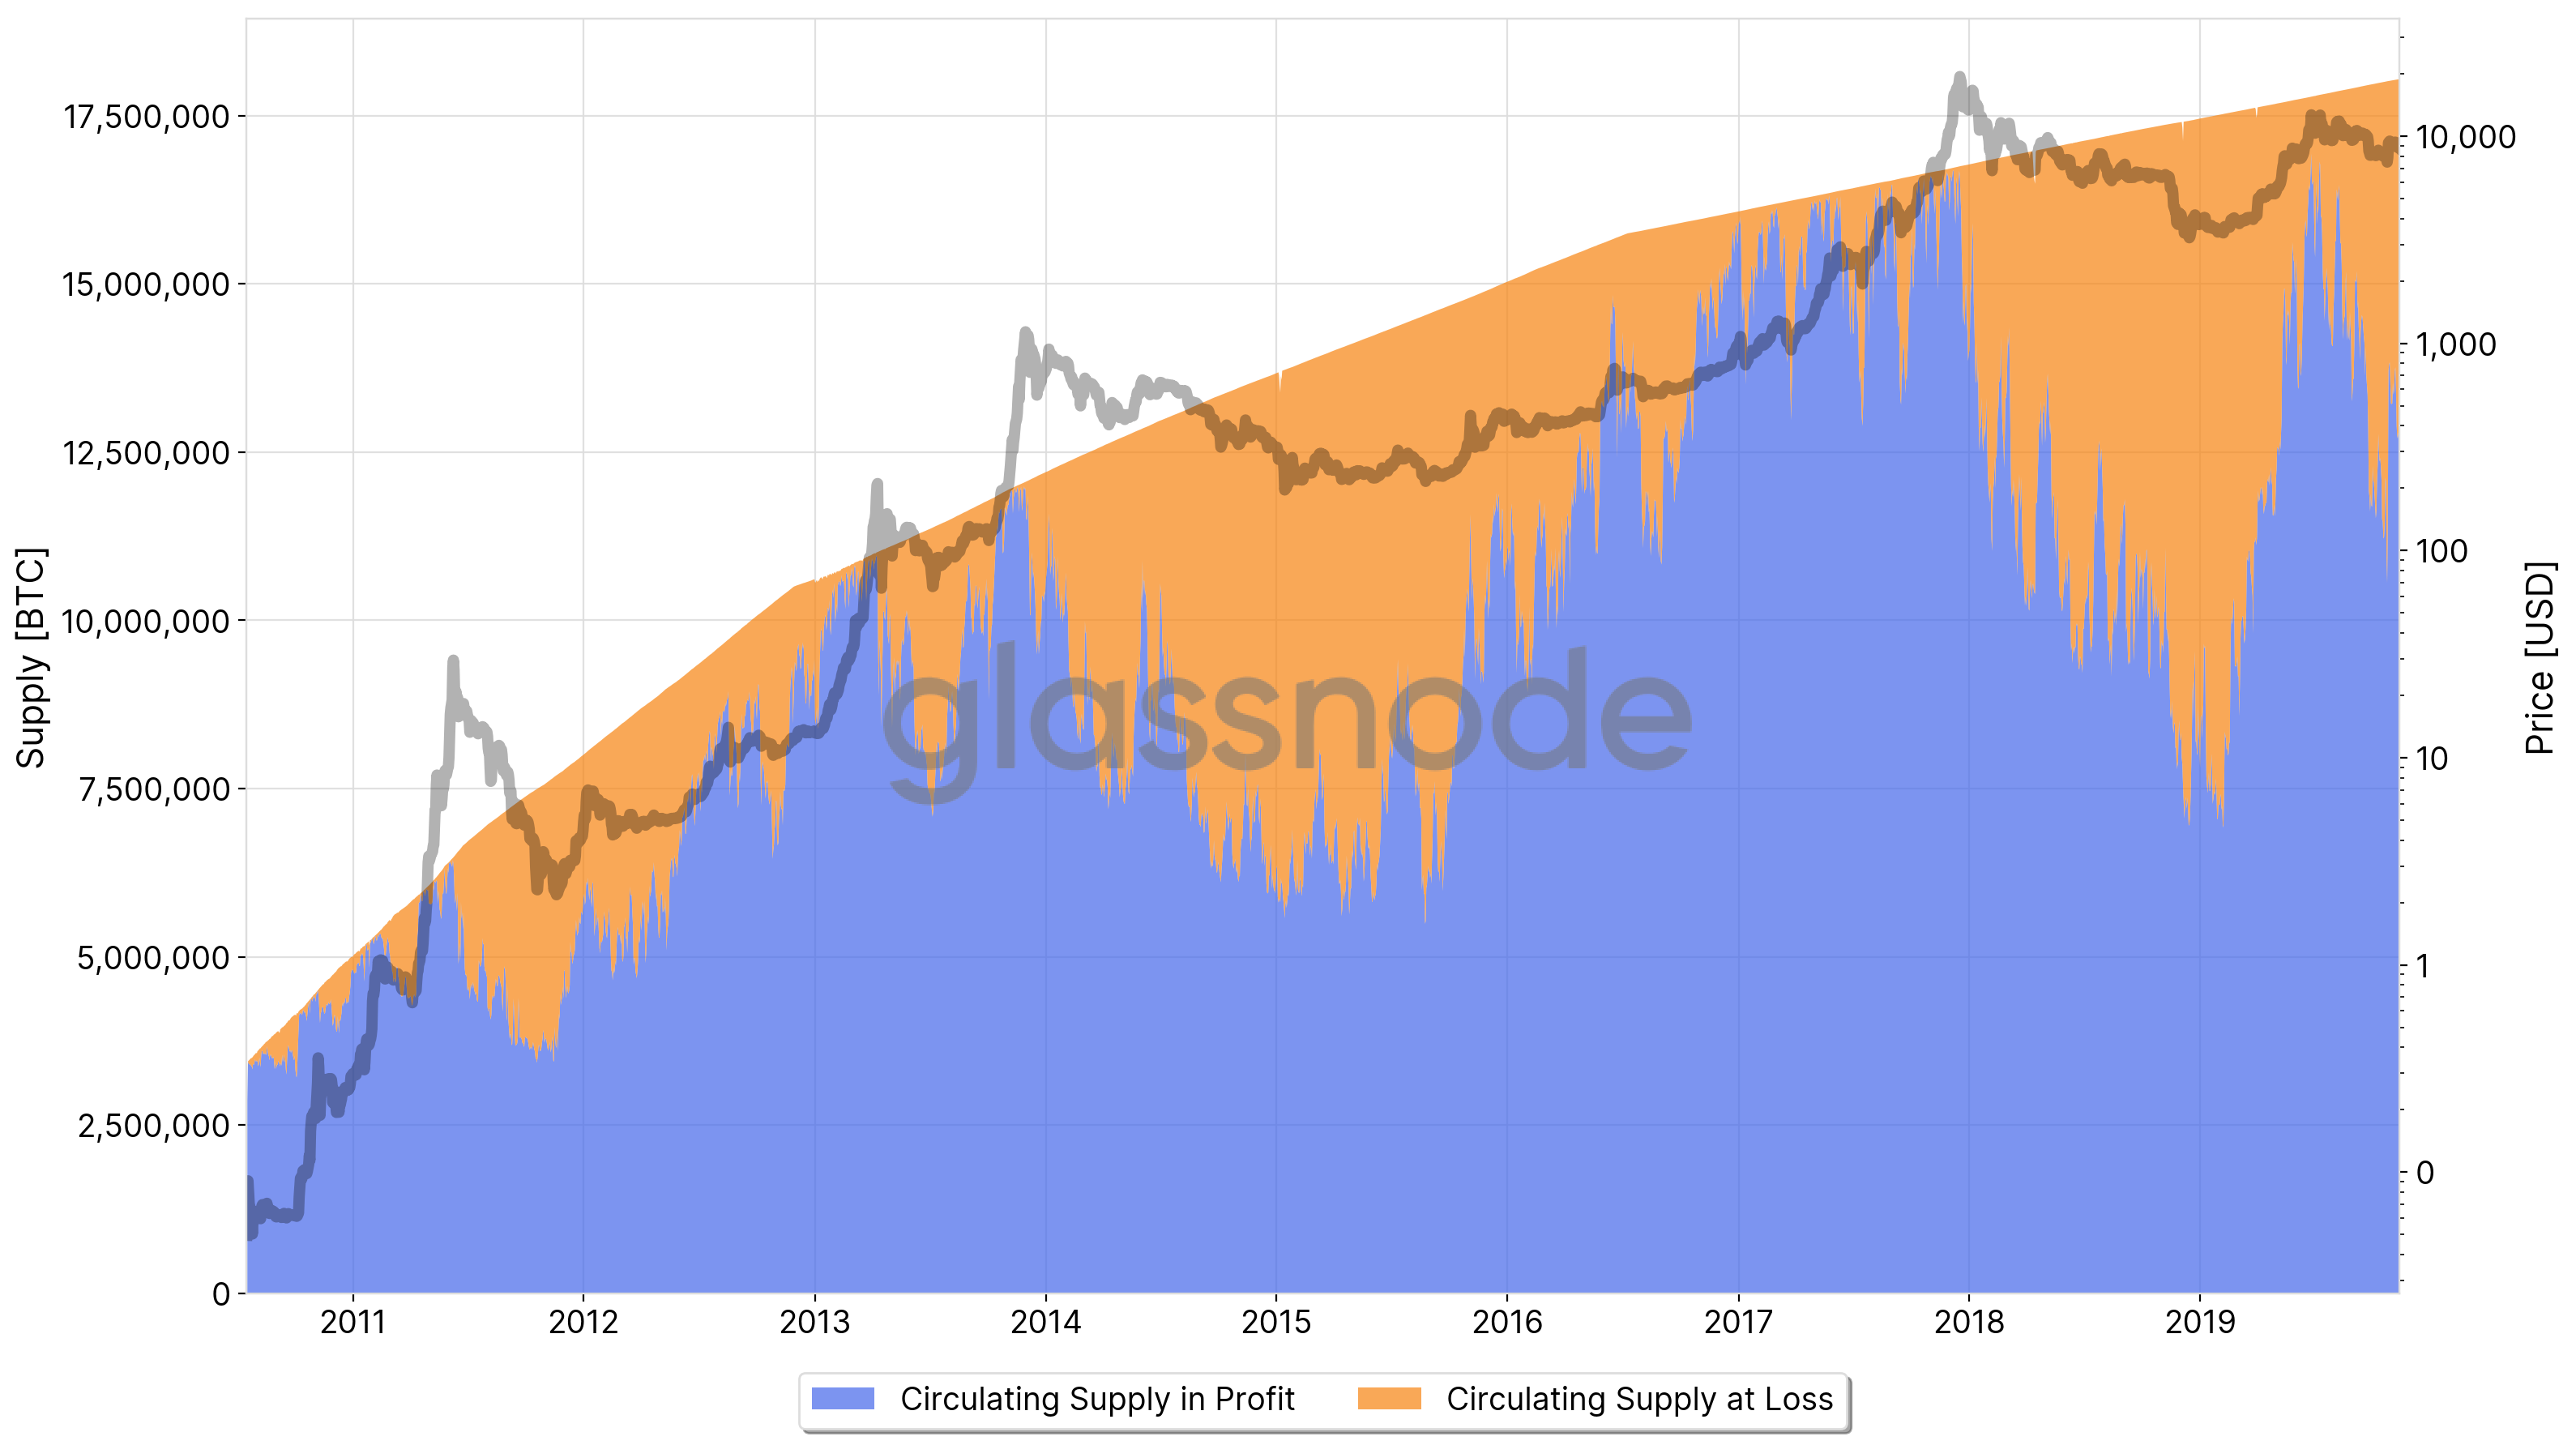 Figure 3 — Circulating Bitcoin Supply in Profit and Loss
Similarly, we adjust this data by dividing by the circulating supply and obtain the relative Bitcoin supply (i.e. percentage) that is in profit/loss.
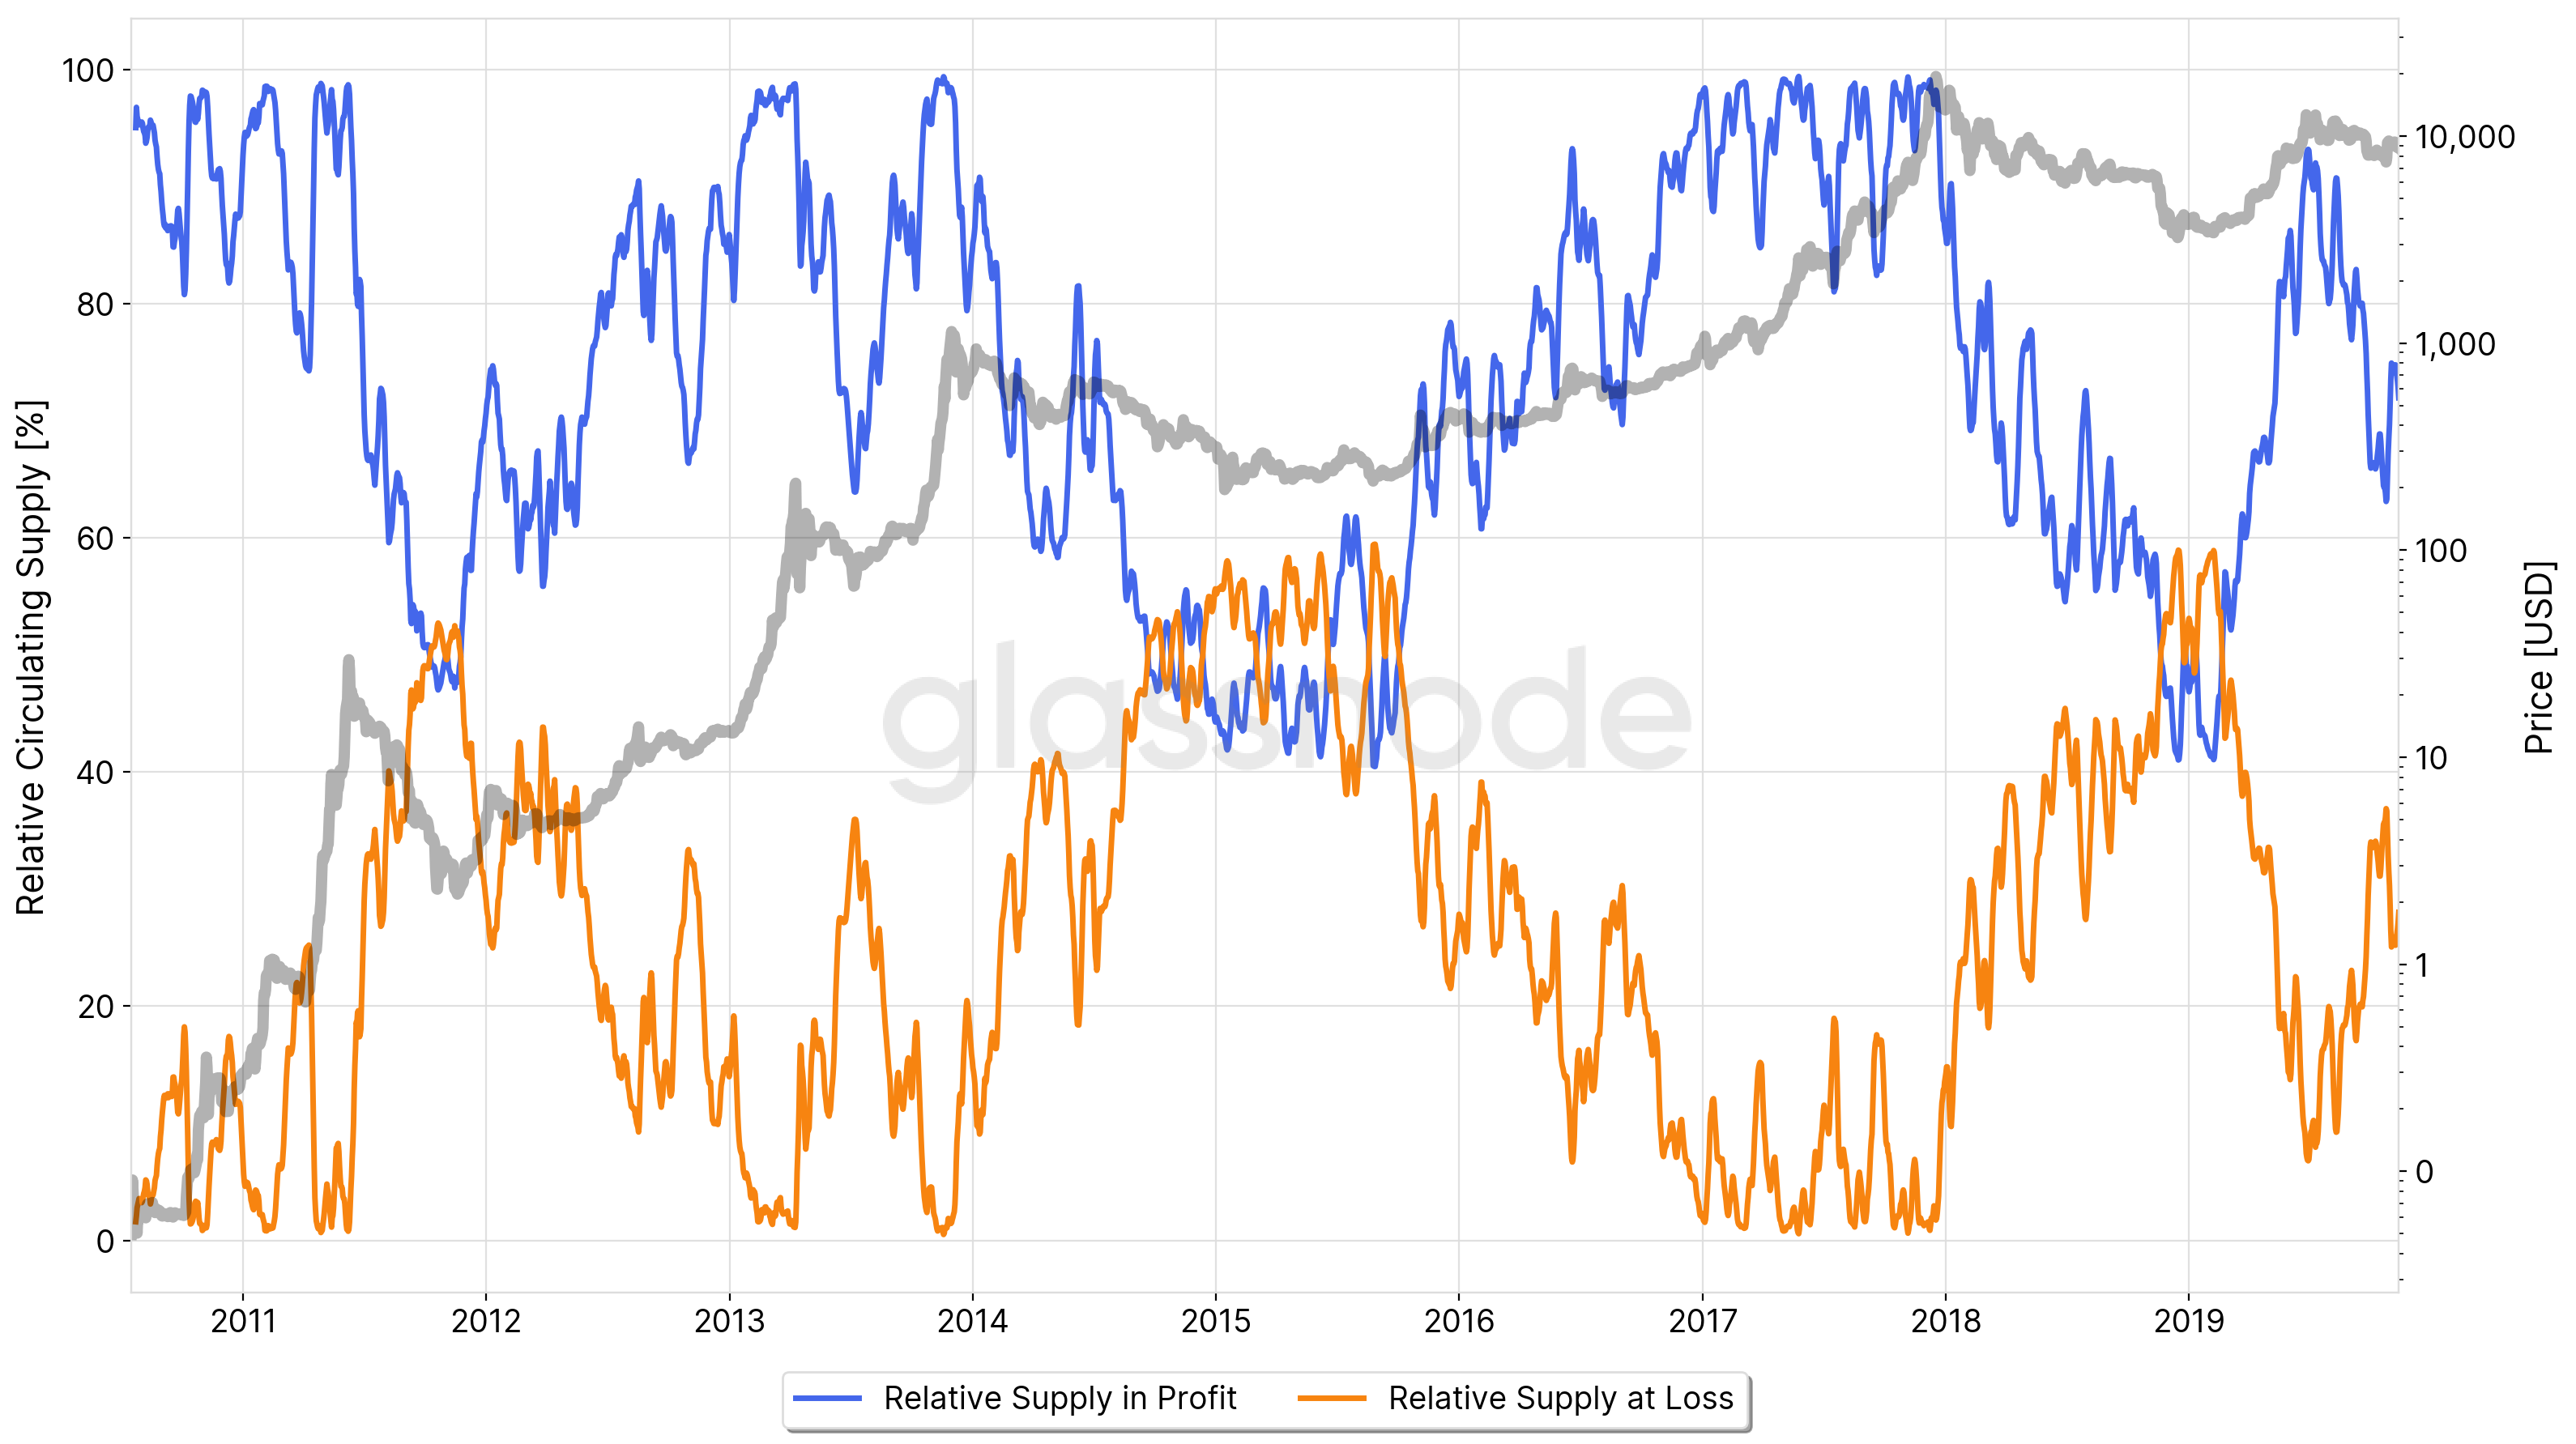 Figure 4 — Relative Bitcoin Supply in Profit and Loss
The resulting graph is a metric we have found to be exceptionally useful to help understand Bitcoin market cycles.
Let’s take close look at the Percent of Supply in Profit, again applying the 50d MA.
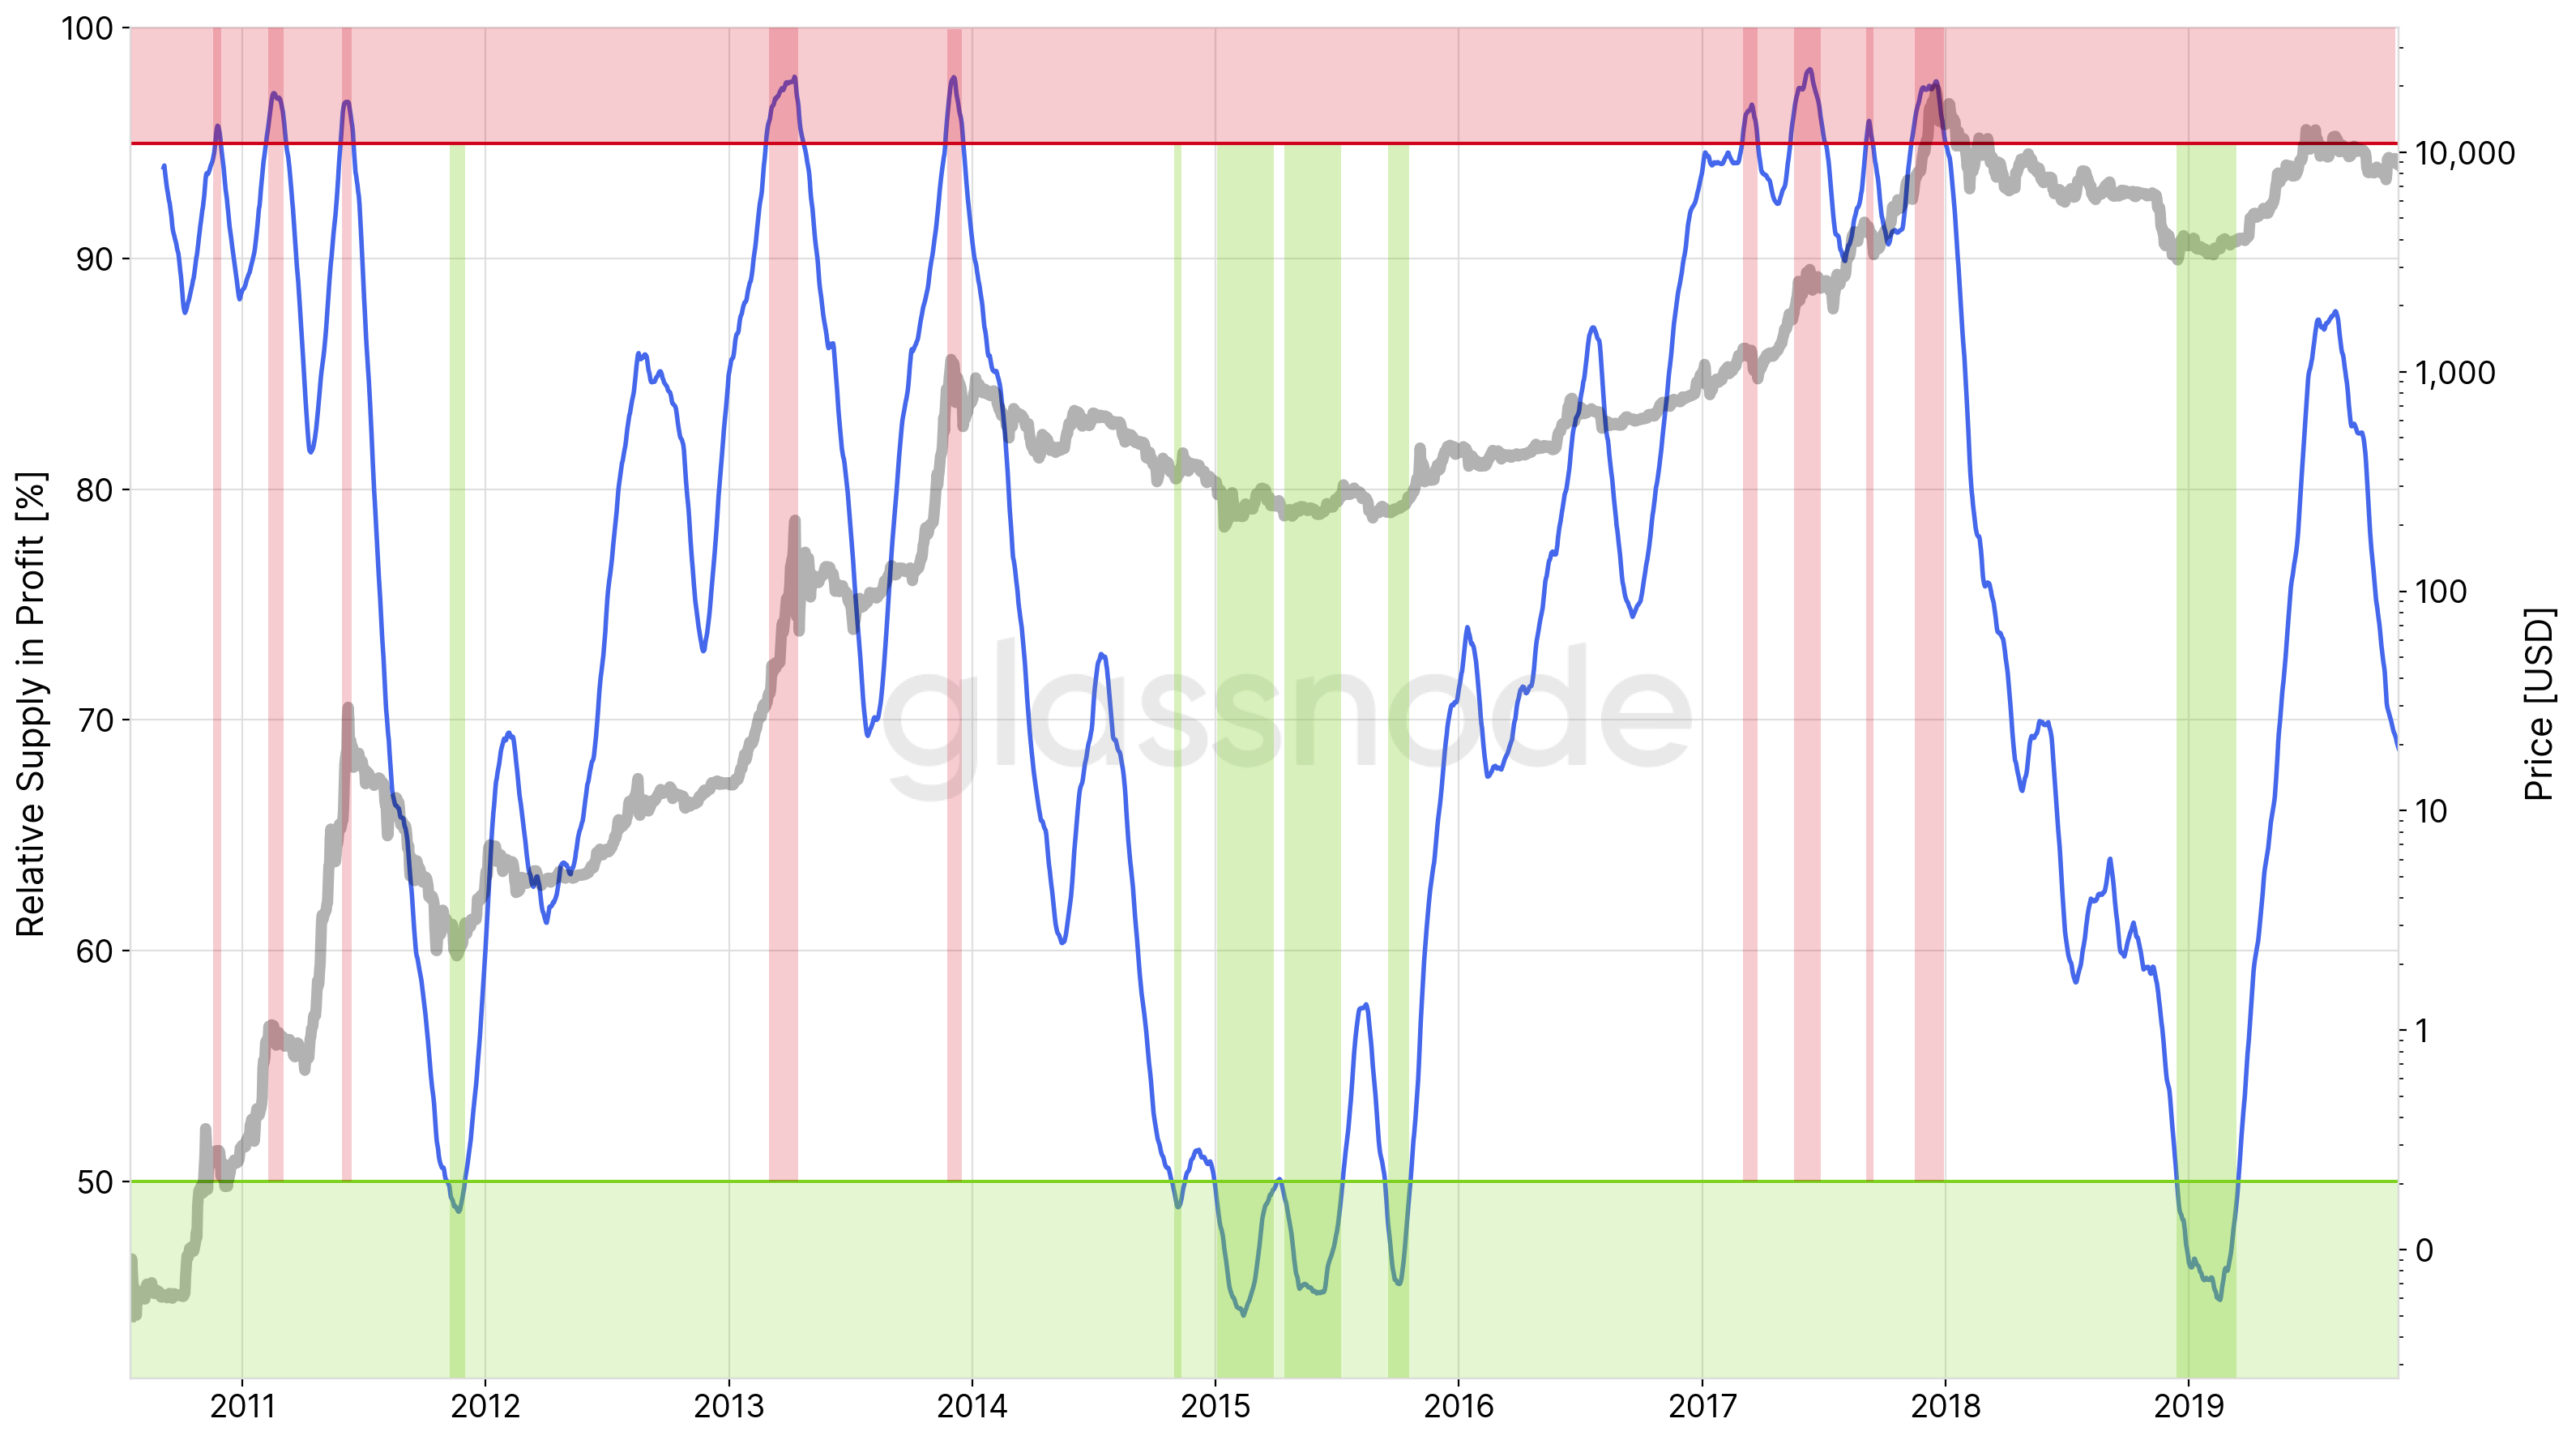 Figure 5 — Relative Bitcoin Supply in Profit, 50d Moving Average
The Percent of Supply in Profit metric represents an oscillator that allows us to better understand the current state of the Bitcoin market:
- In a similar fashion to the relative UTXO count chart above, using a simple threshold at
95%helps to identify market tops. - By looking at periods in which the relative supply in profit falls below
50%, this indicator is useful to help identify market bottoms and convenient entry points.
Live implementations of Supply in Profit/Loss metrics are available in Glassnode Studio:
Unrealised Profit/Loss
Finally, we take a step further and look at the Unrealised Profit/Loss of Bitcoin.
In comparison to simply summing up the circulating supply that is in profit or loss, Unrealised Profit/Loss takes into account the actual USD value by which a bitcoin is in gains/losses. In other words, we weight each circulating bitcoin by the difference between the current price and its realised price and sum up all bitcoins in profit and loss, respectively.
Mathematically speaking Unrealised Profit (UP) and Unrealised Loss(UL) are defined as

and

respectively.
The following graph shows Bitcoin’s raw Unrealised Profit/Loss.
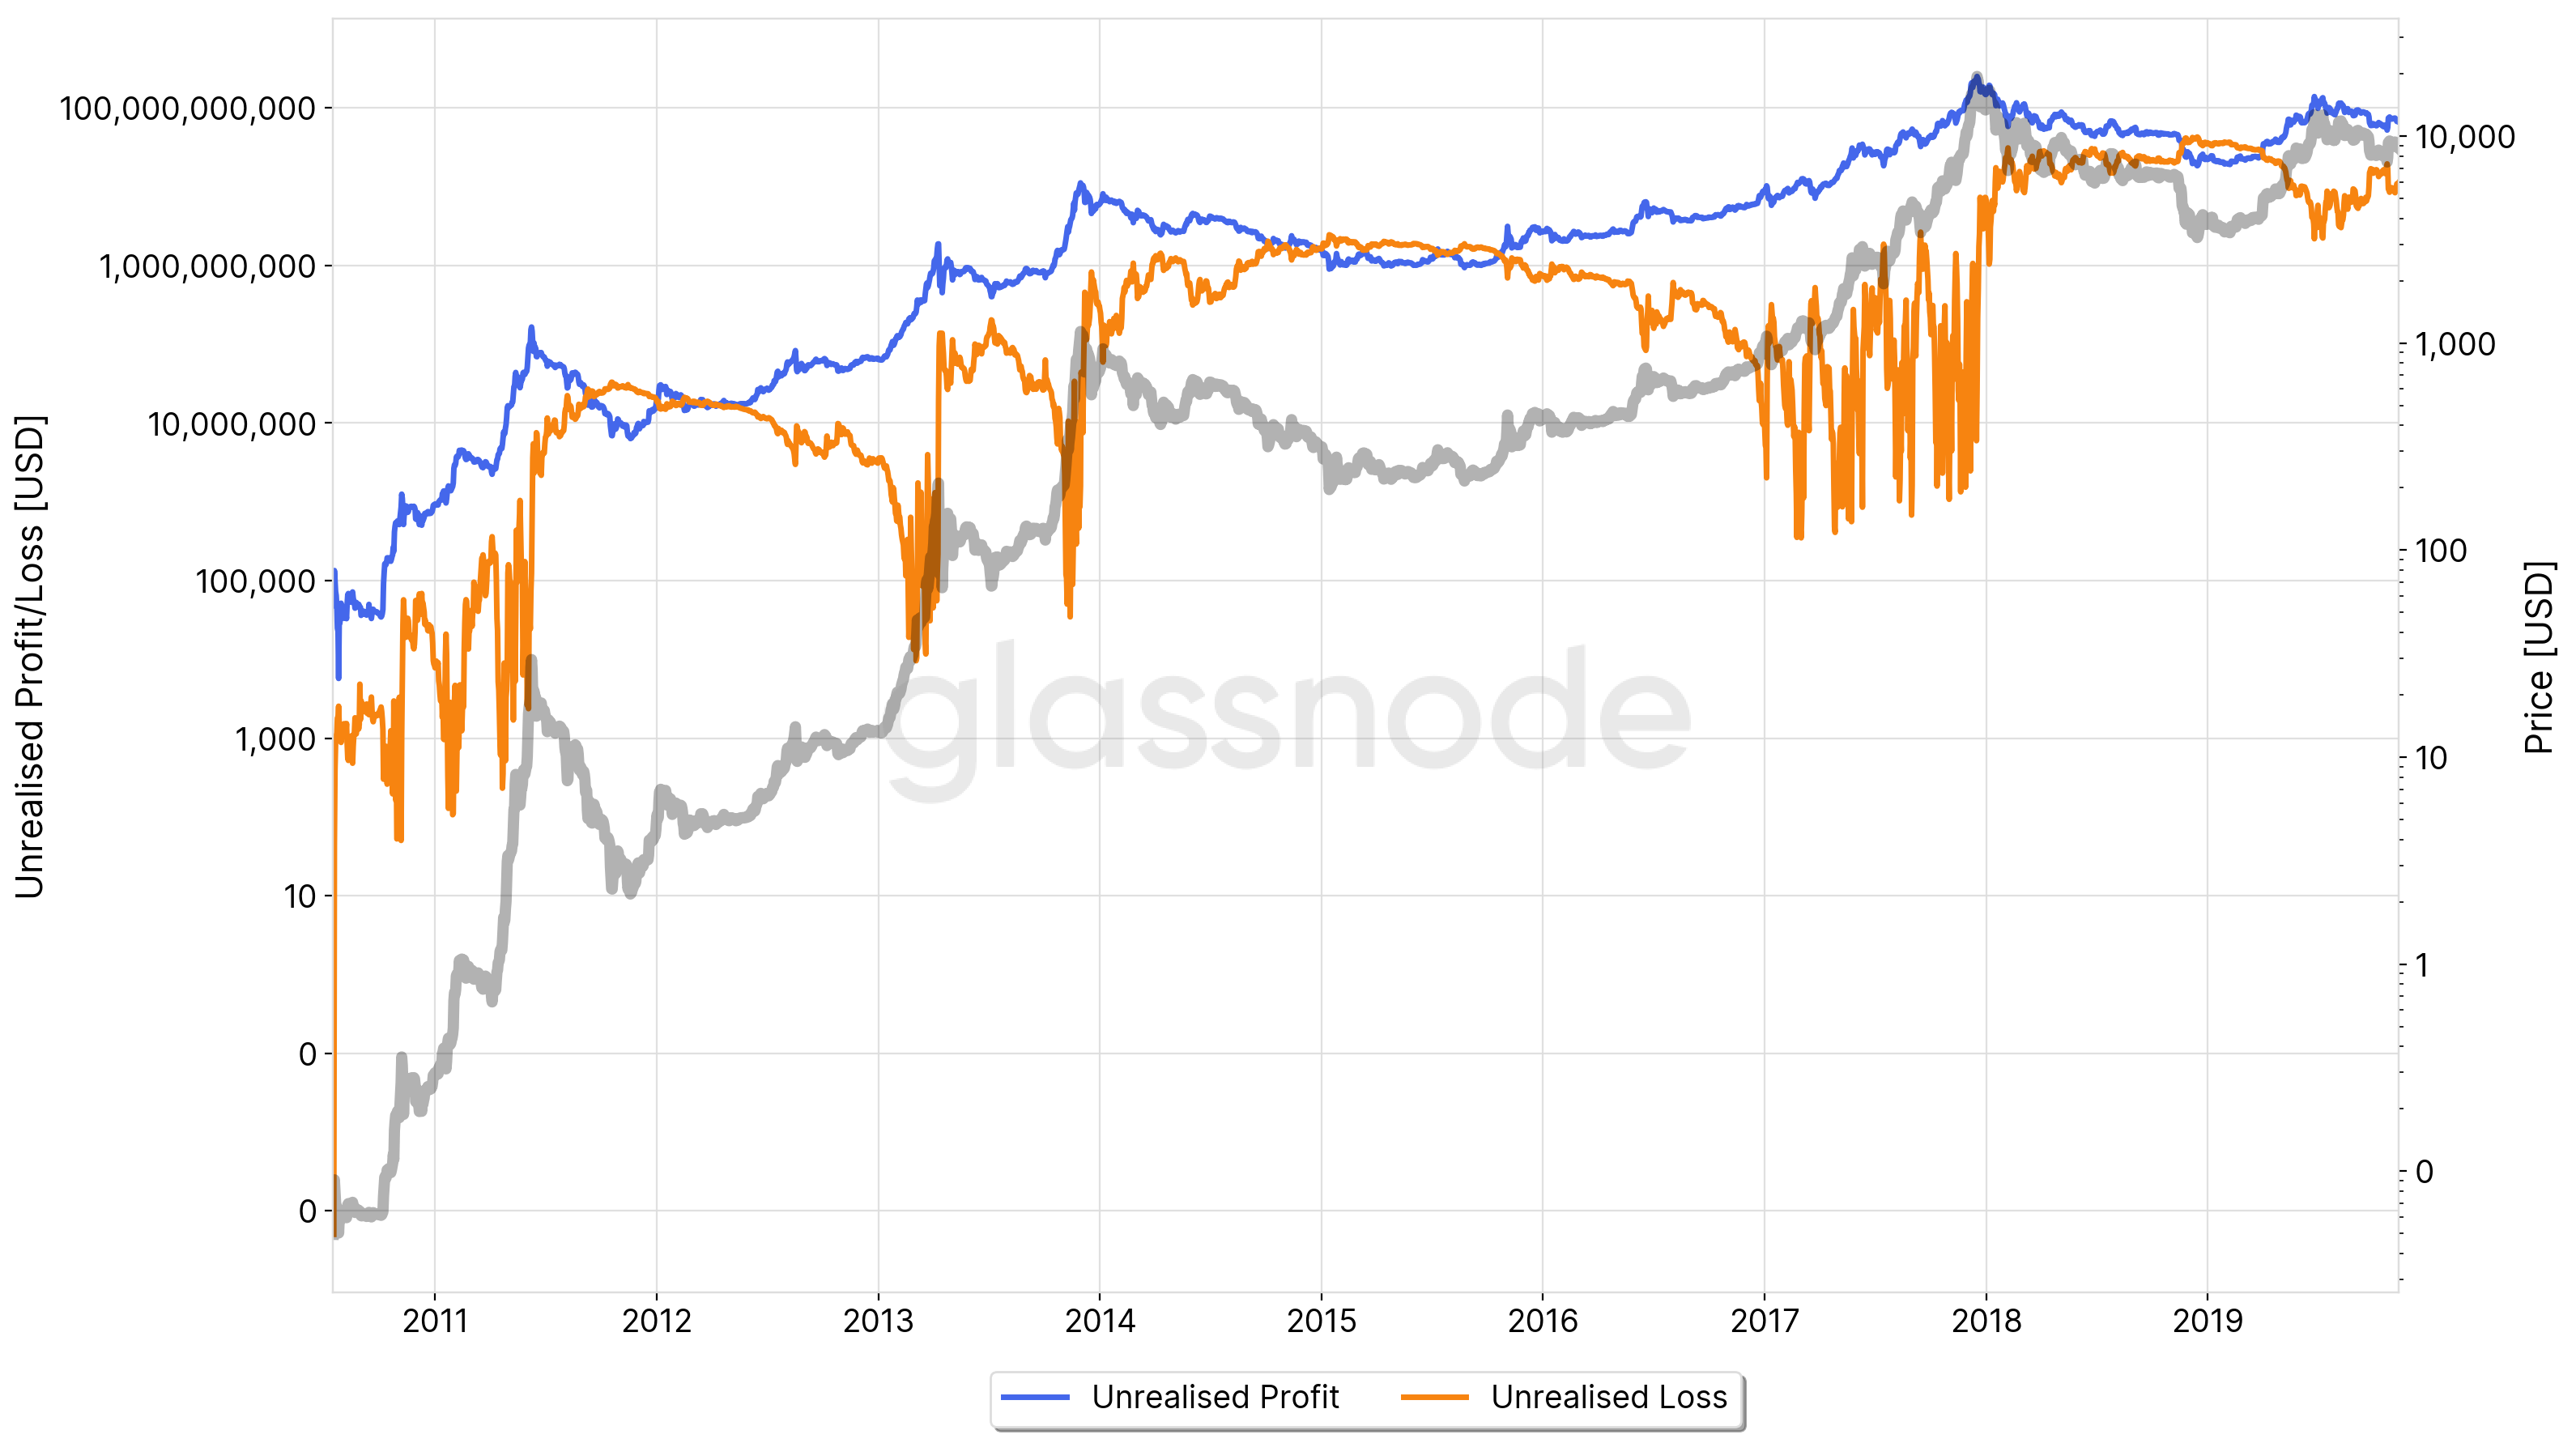 Figure 6 — Unrealised Bitcoin Profit and Loss
While the UP line very much resembles the shape of the Bitcoin price, the amount of unrealised loss (UL) shows a distinctive pattern with clear-cut downward spikes at periods in which the losses are virtually non-existent. These moments naturally correspond to those in which the relative number of bitcoins/UTXOs in profit approaches 100% (see Figures 2+5).
In order to obtain a conclusive and more informative metric, we normalise the data by the market cap, giving us the Relative Unrealised Profit (RUP) and the Relative Unrealised Loss (RUL). The resulting signals clearly reveal distinct patterns at different states of the market cycles.
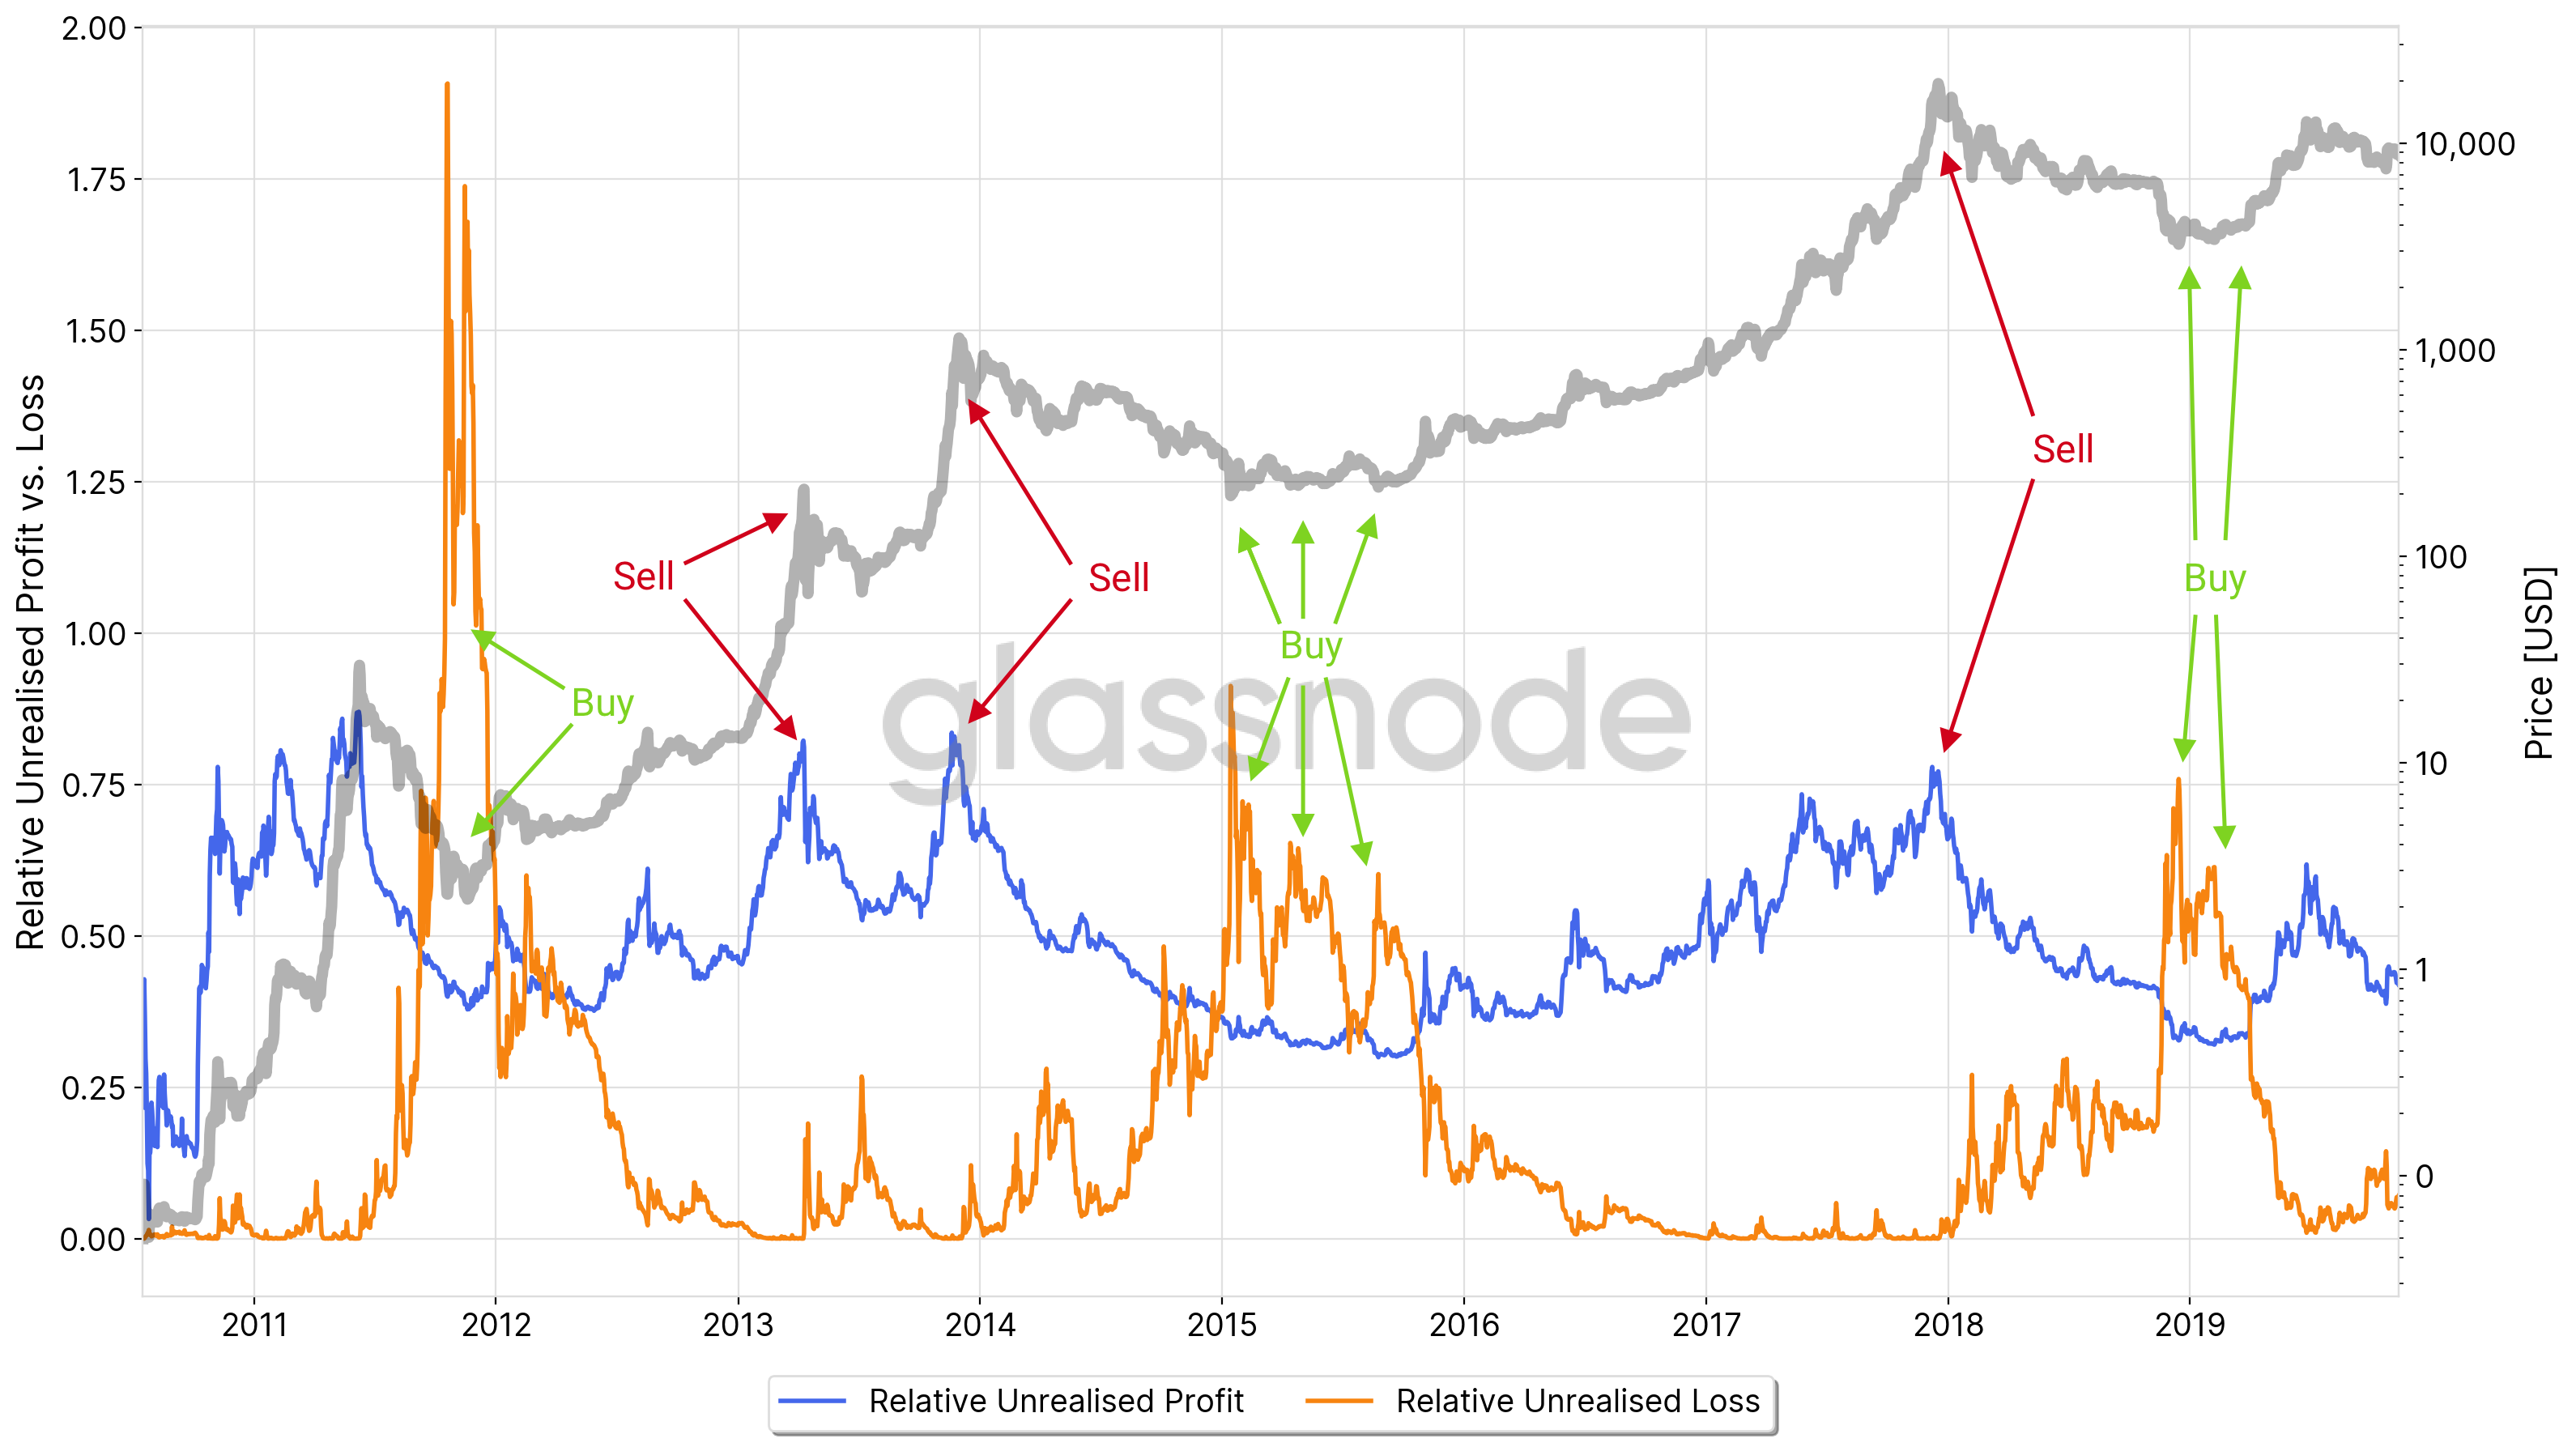 Figure 7 — Relative Unrealised Profit and Loss
In particular we see how the RUP spikes (RUP > 0.75) indicate potential tops and selling points. Conversely, periods in which the RUL exceeds the RUP (RUP < RUL) have been historically indicative of market bottoms and good buying opportunities.
By taking the delta of both curves, we finally calculate the Net Unrealised Profit/Loss (NUPL).
Deconstructing this signal into different bands gives insight into market sentiment derived from on–chain data. The thresholds below are set at 0.0, 0.25, 0.5, and 0.75. Even though arbitrary, historically they show accurate patterns that can be attributed to distinct sentiments throughout the macro cycles of Bitcoin.
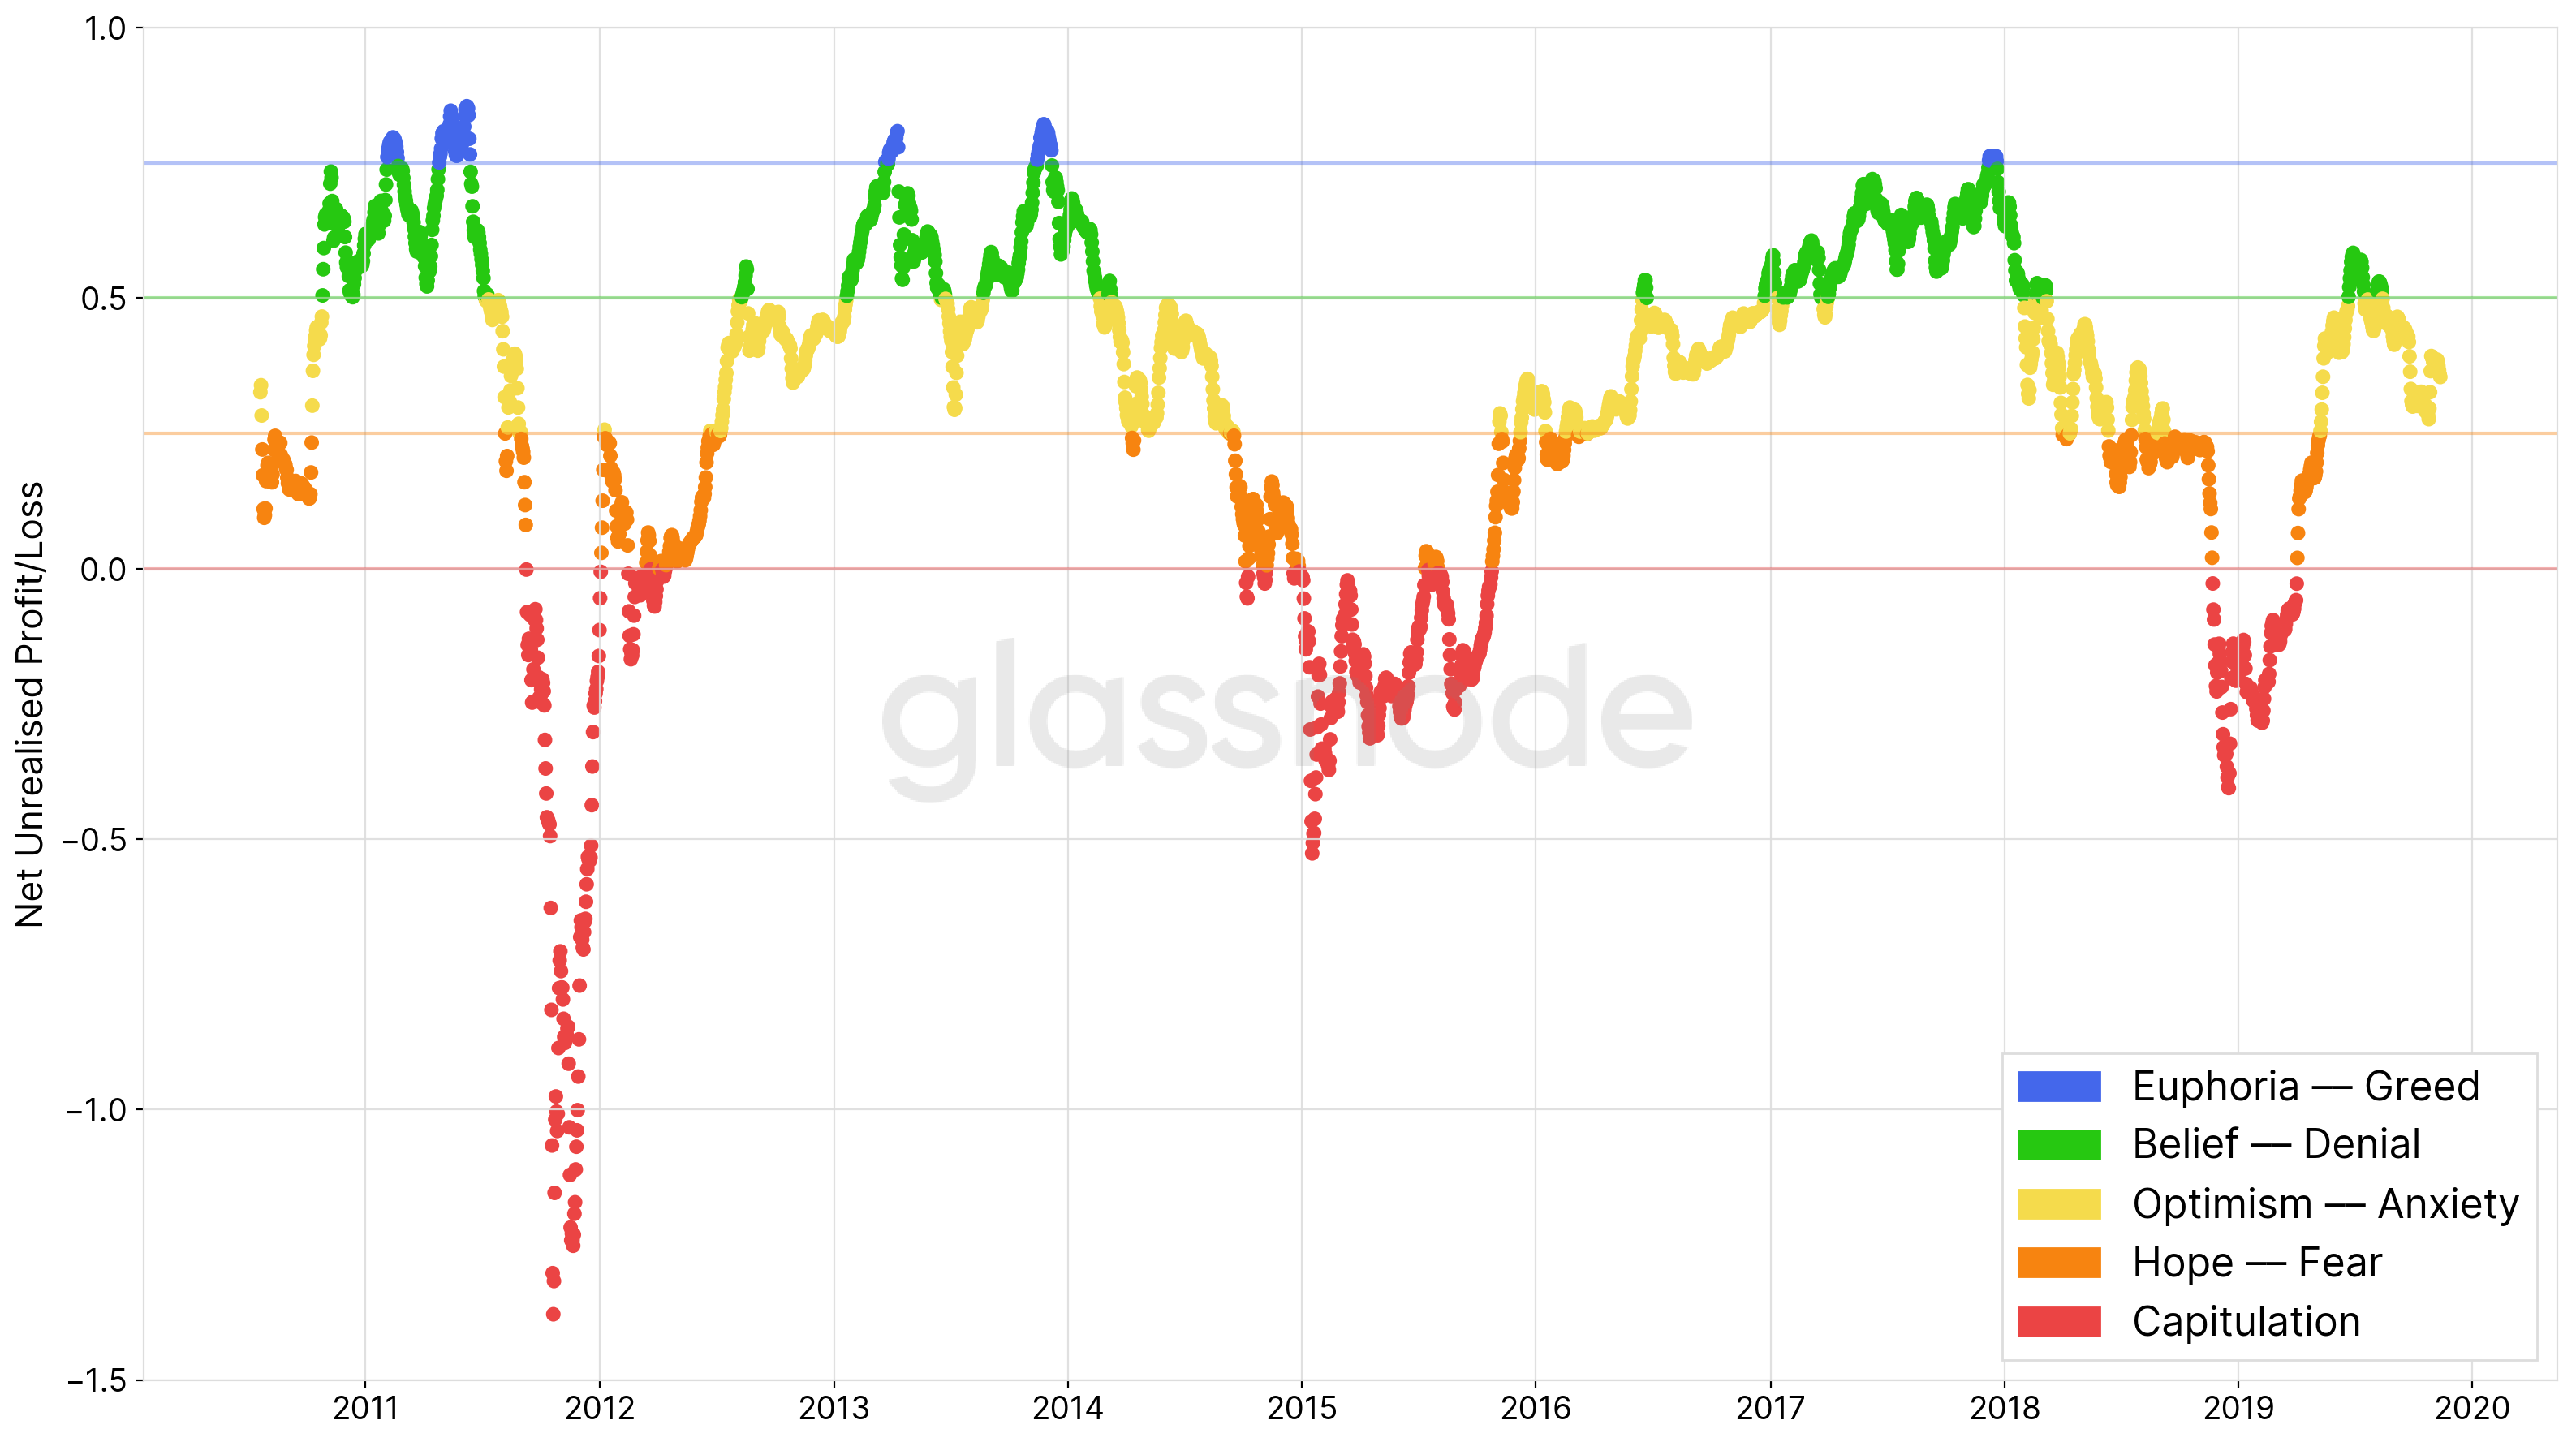 Figure 8 — Net Unrealised Profit/Loss (NUPL)
By mapping these bands to the price of Bitcoin we see how the NUPL represents different periods of the Bitcoin market cycles. Understanding the current NUPL value can help investors navigate through different stages of the market and identify periods of profit taking as well as efficient entry points.
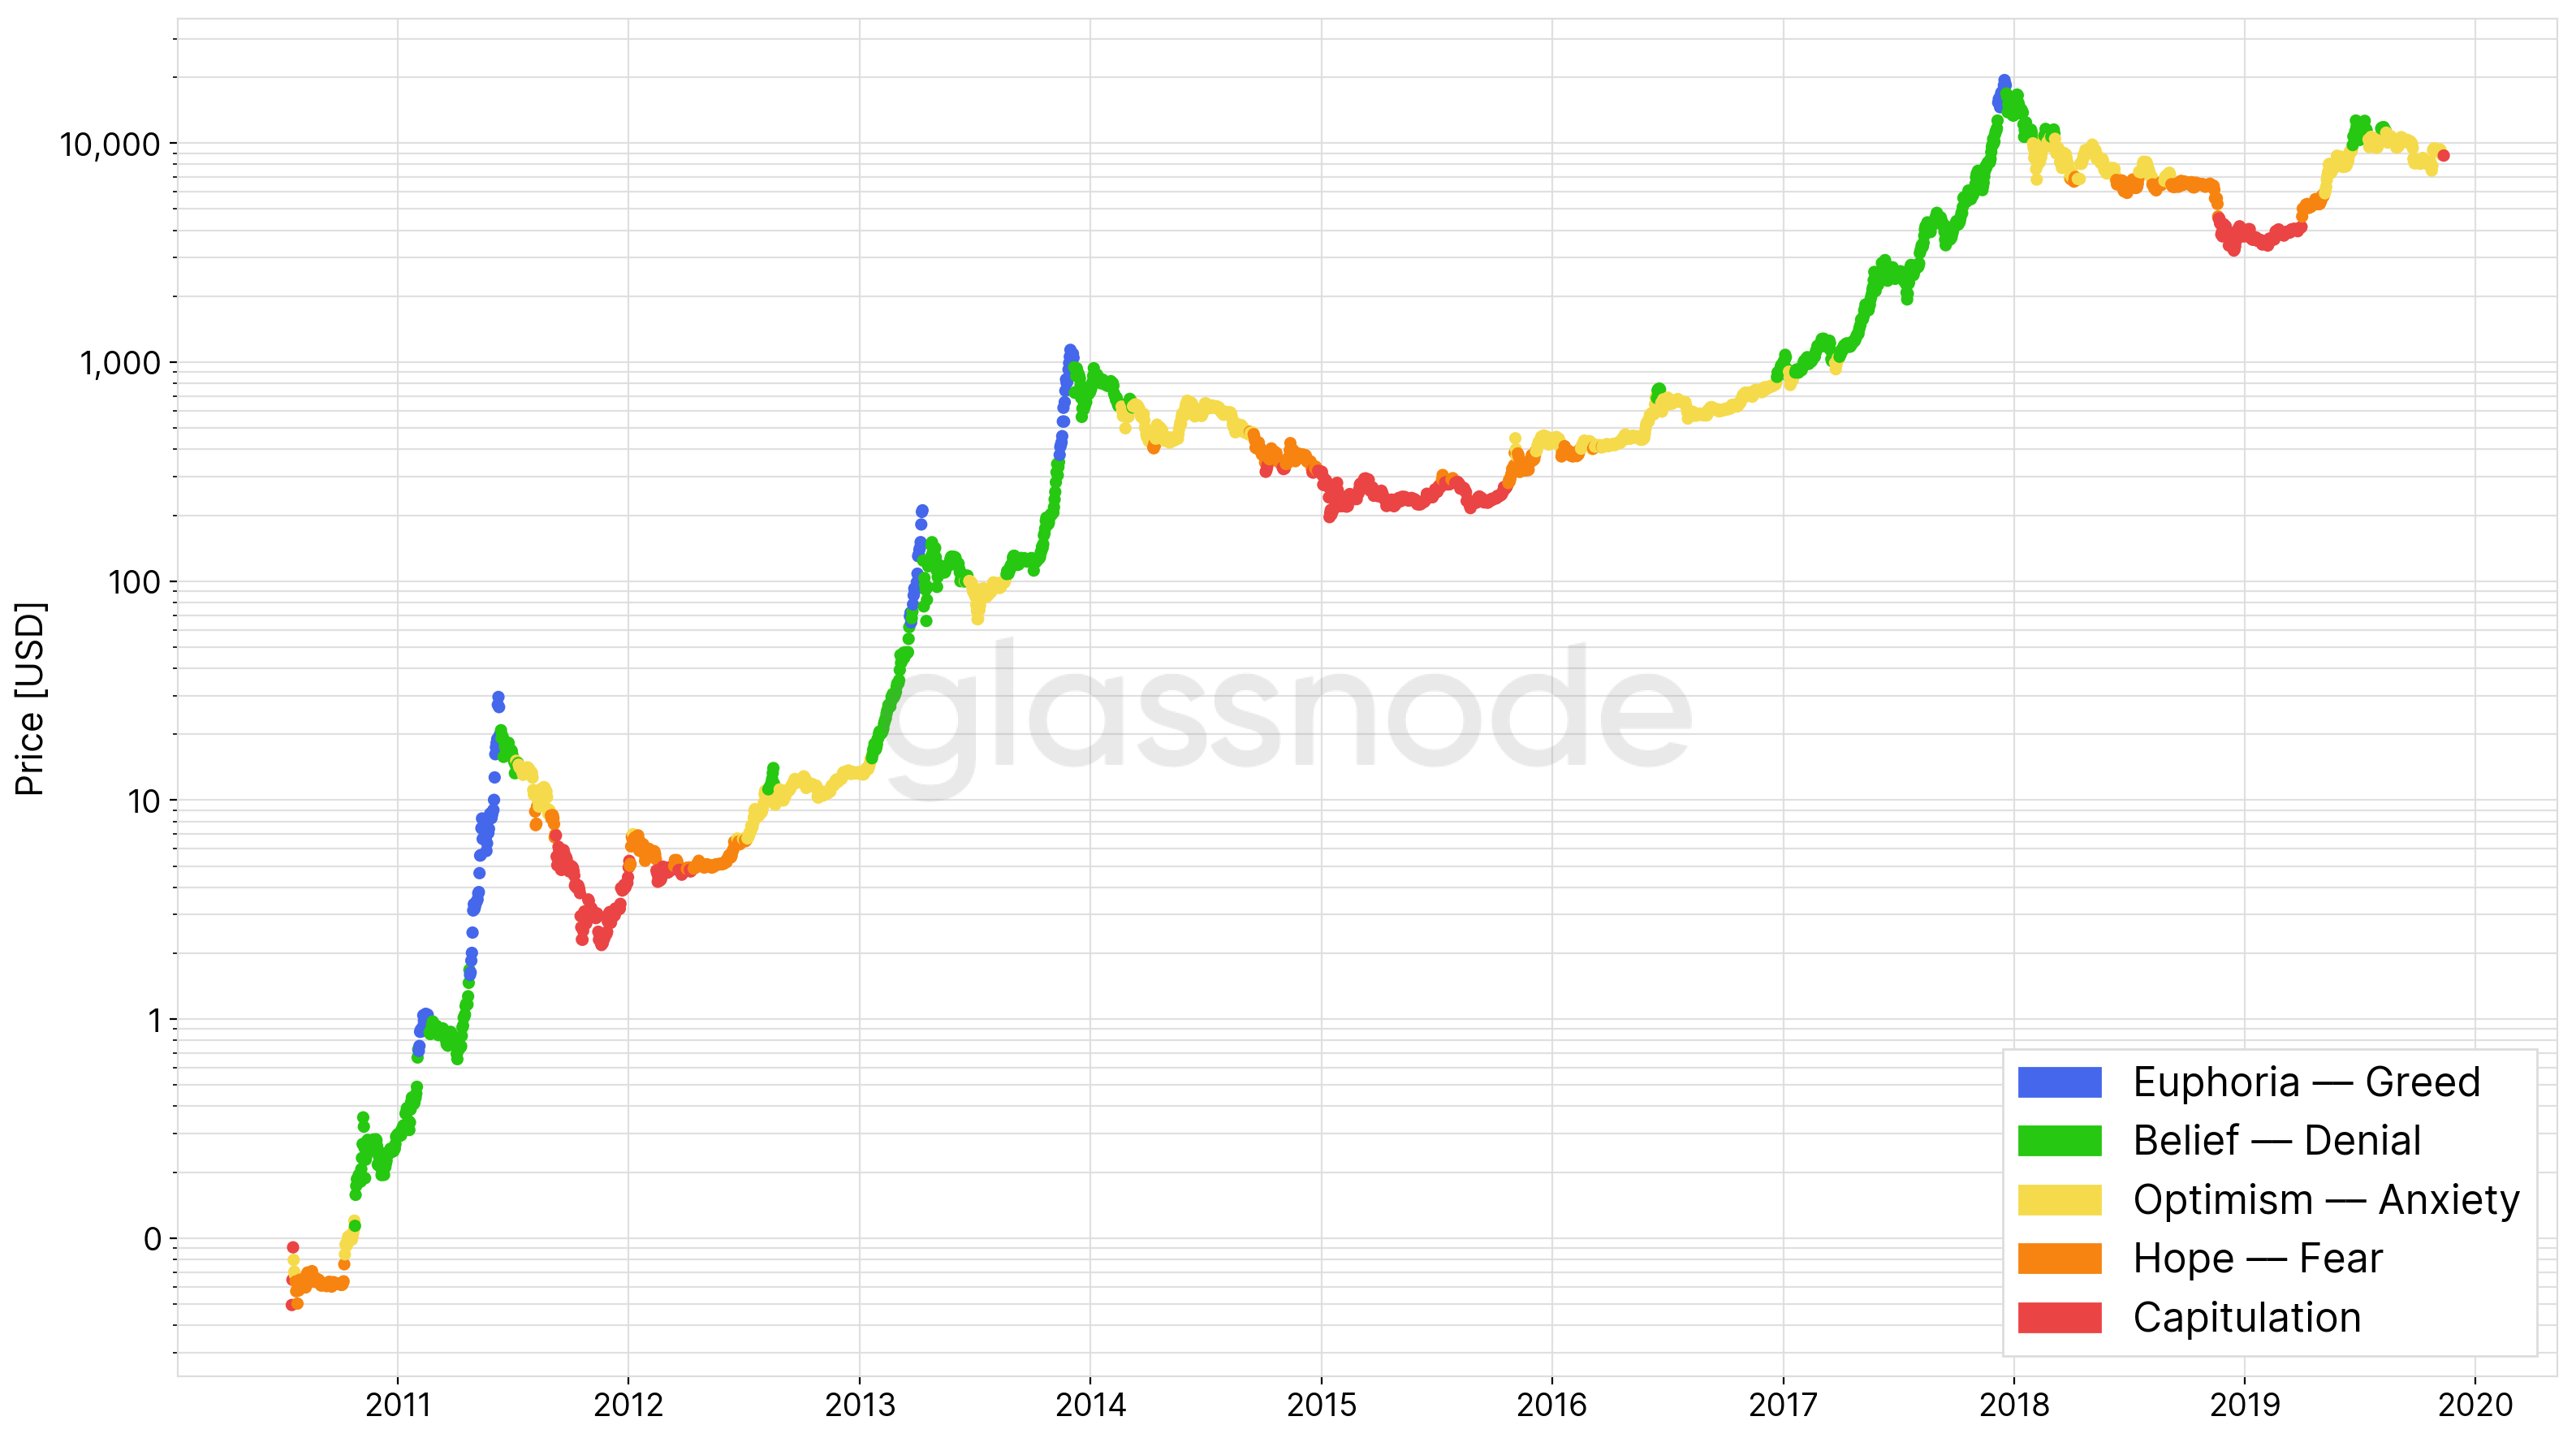 Figure 9 — NUPL Bands applied to the Bitcoin Price
UPDATE: Net Unrealised Profit/Loss has been previously derived by Adamant Capital in a different manner: They calculate it by subtracting realised cap from market cap, and dividing the result by the market cap, i.e.(Market Cap — Realised Cap) / Market Cap. This is mathematically in fact equivalent to the derivation introduced here: Unrealised Profit * Market Cap — Unrealised Loss * Market Cap.
Live implementations of Unrealised Profit/Loss metrics are available in Glassnode Studio:
Net Unrealised Profit/Loss (NUPL) Relative Unrealised Profit (RUP) Relative Unrealised Loss (RUL)
Summary
We explored and presented a set of on–chain metrics that incorporate the relationship between the current price and the realised price of Bitcoin. In particular we defined metrics related to
1) the Number of UTXOs in Profit/Loss, 2) the Bitcoin Supply in Profit/Loss, and 3) the Unrealised Profit/Loss.
These metrics help in understanding the current profit and loss of stakeholders in the Bitcoin network using on–chain data — information that is crucial to evaluate the state of Bitcoin as a Store of Value (SoV).
Moreover, these metrics are indicative of the Bitcoin market cycles and shed light on investor sentiment at different stages, most notably using Net Unrealised Profit/Loss.
With the present work, we have equipped Bitcoin investors with a new set of tools providing a better understanding of Bitcoin’s market cycles and its economics. The introduced metrics are can be used to assist investment strategies that go beyond simple HODLing, and help to avoid buying towards the top and selling near the bottom of Bitcoin’s cycles.
Metrics Overview
UTXOs
Supply
Unrealised Profit/Loss
Net Unrealised Profit/Loss (NUPL) Relative Unrealised Profit (RUP) Relative Unrealised Loss (RUL)

All analyses in this article were done using data from Glassnode Studio. For API access to this data visit the Glassnode API page.
- Sign up for the Glassnode Insights Newsletter
- Follow us and reach out on Twitter
- For on–chain metrics and activity graphs, visit Glassnode Studio
- For automated updates about on–chain activity on exchanges, visit our Glassnode Alerts Twitter
Disclaimer: This report does not provide any investment advice. All data is provided for information purposes only. No investment decision shall be based on the information provided here and you are solely responsible for your own investment decisions.
Glassnode
Contextualised and actionable market insights, reports and analyses drawn from on-chain data.
Thanks to Rafal Bromirski, Glassnode, and Matthias Bachmann.
| Crypto Words has moved! The project has migrated to a new domain. All future development will be at WORDS. | Go to WORDS |