A Note On Variance in Bitcoin Mining
| Crypto Words has moved! The project has migrated to a new domain. All future development will be at WORDS. | Go to WORDS |
A Note On Variance in Bitcoin Mining
By Christopher Bendiksen
Posted September 25, 2019
It doesn’t take much to create FUD in the Bitcoin space, intentional or not. But before we get all worked up over scary graphs, let’s all sit down for a second and look at how things actually work.
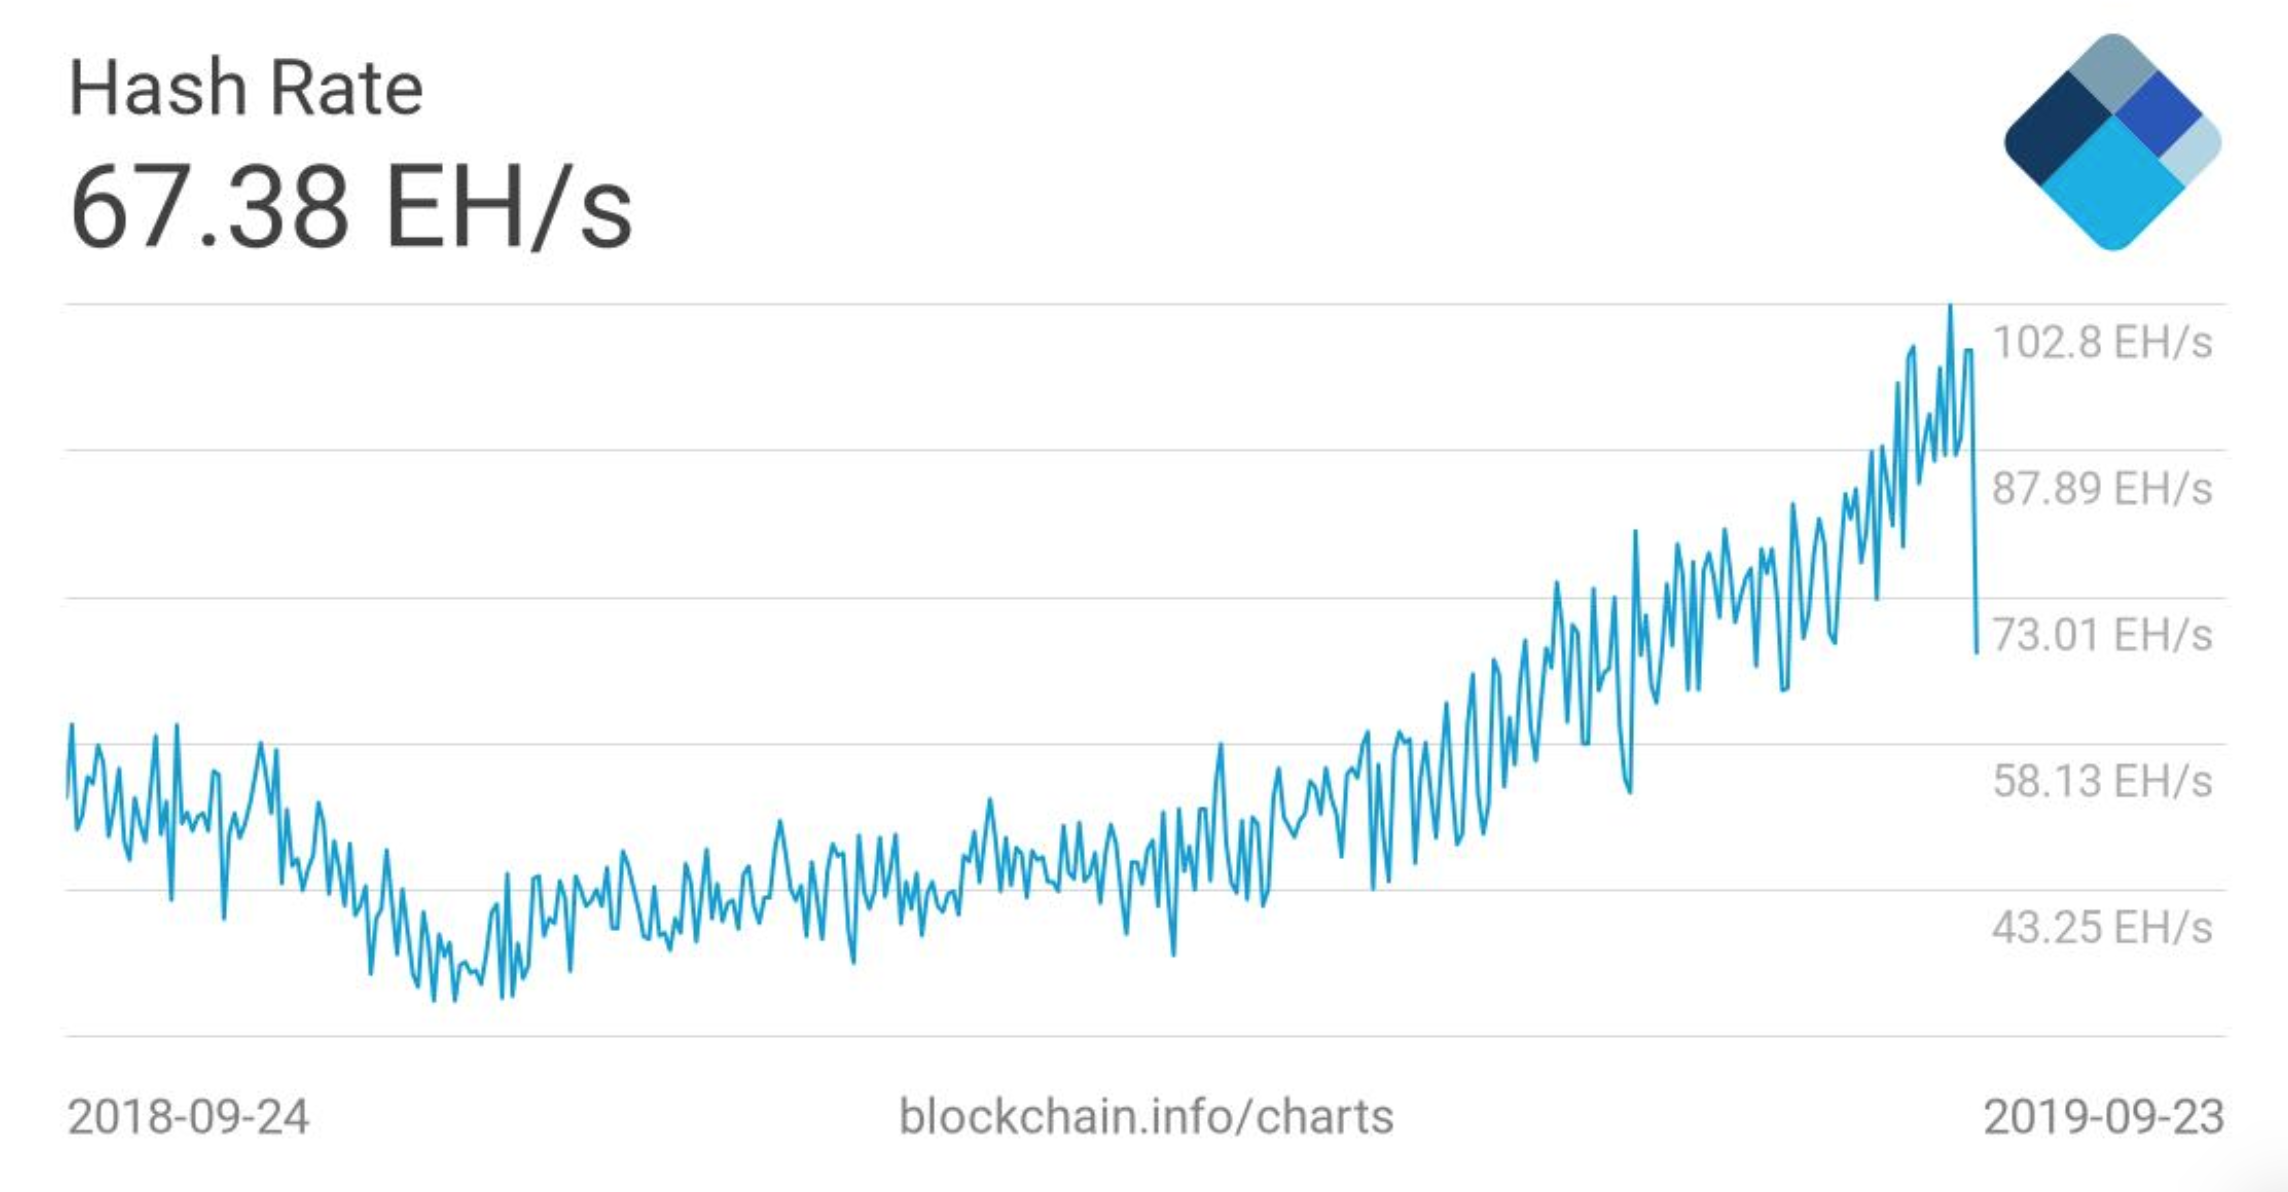
Yesterday (and it seems to be continuing today even though the graphs have reverted to the mean), one after another, Twitter pundits and news outlets started posting worried remarks about the Bitcoin hashrate accompanied by some pretty stark-looking charts of the hashrate dropping hard, in some estimates by more than 50% in less than one week.
 (and this wasn’t even the worst estimate)
On the surface, one can understand the concern. Looking at the charts the numbers appear clear. One day the hashrate tops out at more than 120 EH/s and less than 10 days later it has dropped to 58 EH/s. Seems catastrophic.
It’s not.
But to understand why, we need to look a little deeper into how these graphs are calculated.
So let’s start with something you might not know: the Bitcoin hashrate is actually not a known measure. It is technically not even knowable (kinda like the number of air atoms in a balloon isn’t knowable). All one can do is estimate the hashrate based on the frequency of past blocks and the mining difficulty. And while those estimates can be really good they have to be done right.
As an example of an estimate done properly we can actually look at how the Bitcoin protocol itself deals with this issue in difficulty adjustments.
It works (kinda) like this: Every 2016 blocks, the protocol calculates the average block time over that interval. It then compares the result against its benchmark of 10 minute blocks. If the blocks came 8% faster than 10 minutes, it increases the mining difficulty by 8%. If they came 15% slower than 10 minutes, it decreases the difficulty by 15%. This ensures that the mining difficulty is set such that blocks arrive every 10 minutes on average.
This also has a host of other consequences which we discuss in some more detail here:

Estimating the hashrate is done in a very similar fashion. While the protocol doesn’t bother itself with the actual nominal hash power measure, we can use the same information plus the difficulty to arrive at an estimate of the hashrate. Knowing the difficulty, one can know what time it should take a certain amount of hash power, on average, to find a certain amount of blocks. This estimate gets more accurate the longer the interval one measures it over.
And herein lies the essence of the problem. If the measurement interval is too short, the estimate becomes vulnerable to the inherent variance in block times.
Block times are Poisson distributed
That sounds fancy but somewhat simplified, all it means is that the probability of finding a new block remains the same, no matter how many hashes you have already tried.
Which has some pretty counterintuitive effects such as the following statement:
“No matter how long the network’s been hashing since the last block, on average, the next block is always 10 minutes away.”
Weird, I know.
But the most important effect in terms of our discussion here is that it leads to probabilistic variance in the block times. In other words, while blocks come out at 10 minutes on average, sometimes they take 14 minutes, sometimes 58 minutes, sometimes 33 seconds. You get the gist.
This impacts these hashrate estimates, and the impact is greater the shorter their measurement interval. When you look at the daily hashrate estimates, the curves are super spiky in both directions. This is not because the hashrate fluctuates wildly on a daily basis (but you’d be surprised how many people, even some within the mining industry, actually believe this).
The reason is that probabilistically distributed variance does funny things sometimes. Sometimes a bunch of fast blocks happen in relatively rapid succession. Sometimes the opposite. This is what causes those spikes. A series of randomly slow or quick blocks happen within the measurement interval of the hashrate estimation algorithms, which is then extrapolated to make it seem like the hashrate either cratered or exploded.
As per usual, Nic Carter does everyone the favour of actually running the numbers and showing exactly what happened these last few days. Have a look:
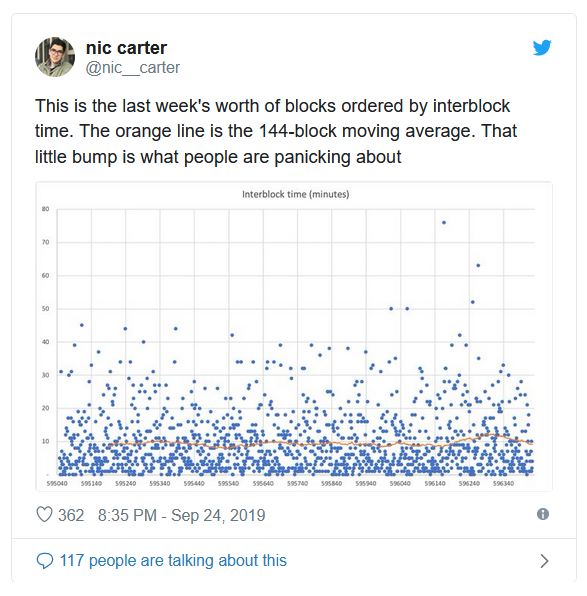
See those five blocks above 50 minutes in the upper right corner? That’s pretty much what this was all about. His next tweet shows the event in context of (almost) the entire block history:
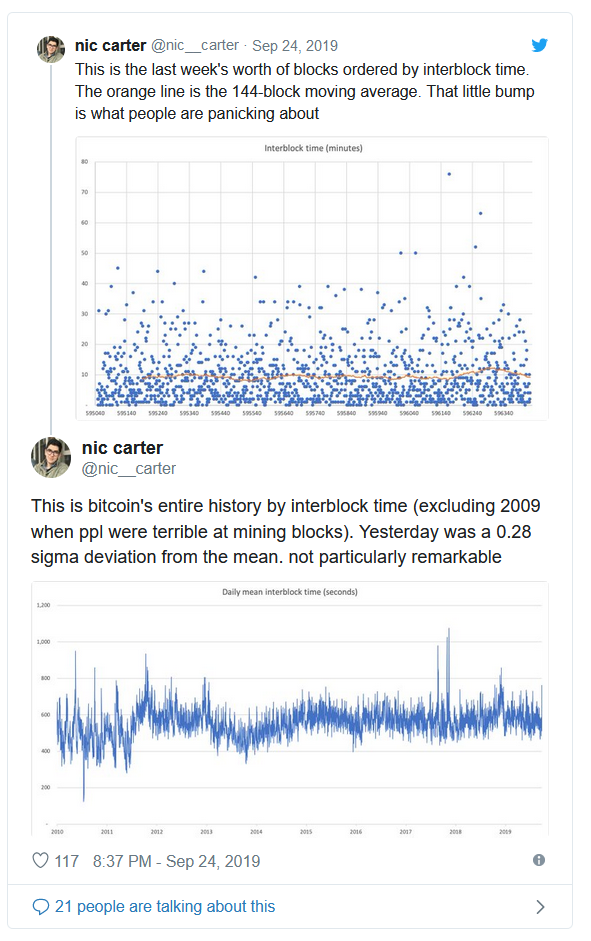
As you can see, this latest event (the right-most upward spike) was indeed spikier than “normal”, but only marginally spikier.
So what’s the real hashrate then?
Like I said: no one knows — at least not precisely.
But let’s revisit the figures from the beginning of this post. The hashrate never actually reached 120 EH/s. Nor did it drop to 58 EH/s. When reading these graphs the best way to do it is to look at the 7 or 14 day averages. You’ll remember from above that the Bitcoin protocol itself uses the 14 day average for its Difficulty Adjustment Algorithm — for this exact reason.
When looking at the 7 or 14 day estimates for example here (btw Sipa, the creator of that website, is Bitcoin developer Peter Wuille):
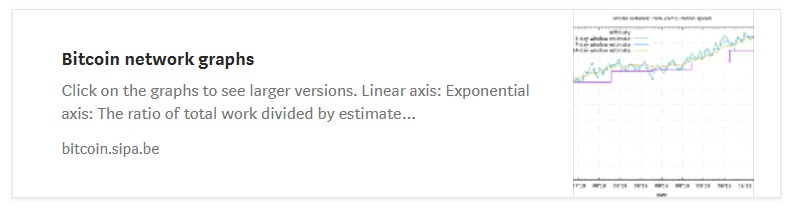
You’ll see that the curve is, unsurprisingly, much smoother and easier to read. The spikes are dampened and large tops and bottoms are much more rare — the noise is filtered out. In addition, you’ll see that the hashrate probably hasn’t even reached 100 EH/s yet, let alone 120 EH/s. And if there is indeed a large drop-out of mining power happening somewhere (doesn’t appear to be the case), it will materialise soon enough on the 14 day average curve.
And until it does, my plea is one that I feel like I’ve repeated many times over:
Resist the urge to cry wolf. At the very least look into how measurements work before sounding the alarm at readings you find weird.
FUD isn’t always intentionally generated, but it is FUD nonetheless.
Disclaimer
Please note that this Blog Post is provided on the basis that the recipient accepts the following conditions relating to the provision of the same (including on behalf of their respective organisation).
This Blog Post does not contain or purport to be, financial promotion(s) of any kind.
Digital assets and related technologies can be extremely complicated. The digital sector has spawned concepts and nomenclature much of which is novel and can be difficult for even technically savvy individuals to thoroughly comprehend. The sector also evolves rapidly. With increasing media attention on digital assets and related technologies, many of the concepts associated therewith (and the terms used to encapsulate them) are more likely to be encountered outside of the digital space. Although a term may become relatively well-known and in a relatively short timeframe, there is a danger that misunderstandings and misconceptions can take root relating to precisely what the concept behind the given term is.
The purpose of this Blog Post is to provide objective, educational and interesting commentary. This Blog Post is not directed at any particular person or group of persons. Although produced with reasonable care and skill, no representation should be taken as having been given that this Blog Post is an exhaustive analysis of all of the considerations which its subject matter may give rise to. This Blog Post fairly represents the opinions and sentiments of its author at the date of publishing but it should be noted that such opinions and sentiments may be revised from time to time, for example in light of experience and further developments, and the blog post may not necessarily be updated to reflect the same. The opinions expressed in this blog post are the opinions of CoinShares (UK) Limited and do not represent the opinions of Sapia Partners LLP. The blog post content is for general informational purposes only and is not intended to provide specific advice or recommendations for any individual or on any specific security or investment product. It is only intended to provide education about the financial industry.
Nothing within this Blog Post constitutes investment, legal, tax or other advice. This Blog Post should not be used as the basis for any investment decision(s) which a reader thereof may be considering. Any potential investor in digital assets, even if experienced and affluent, is strongly recommended to seek independent financial advice upon the merits of the same in the context of their own unique circumstances.
© 2019 CoinShares. All rights reserved.